CRUDE OIL & GOLD TALKING POINTS:
- Crude oil prices decline most in three weeks on dismal inventory data
- Gold prices idle as bond yields and US Dollar diverge in risk-off trade
- European politics, US-China trade war to put traders on the defensive
Crude oil prices plunged, recording the largest daily drop in three weeks, as EIA inventory flow data reveled a much larger-than-expected build of 4.74 million barrels last week. Investors were expecting to see a 1.28-million-barrel drawdown, although leading API statistics hinted at an increase yesterday.
Meanwhile, gold prices marked time as market sentiment soured. Bond yields tracked stocks lower – complementing the metal’s appeal as a non-interest-bearing alternative – but any support from this appeared to be offset as haven-seeking flows buoyed the US Dollar. That undercut anti-fiat demand.
CRUDE OIL PRICES MAY FALL WITH STOCKS IN RISK-OFF TRADE
Asia Pacific markets followed Wall Street lower, and more of the same is hinted ahead. Indeed, bellwether S&P 500 futures are trading convincingly in the red. That bodes ill for cycle-sensitive oil prices, while gold may continue to struggle as baseline lending rates and the Greenback diverge.
Investors face a variety of headwinds. Eurozone PMI and German IFO data may point to sluggish regional growth and shaky business confidence as Brexit uncertainty deepens all the while EU Parliament elections threaten to usher in a wave of eurosceptics hoping to constrain and perhaps even dismantle the bloc.
This is on top of US-China trade war escalation. The US is now considering blacklisting five Chinese surveillance companies including Megvii, cutting them off access to US components and software. That marks a broadening of last week’s analogous action against technology giant Huawei.
Did we get it right with our crude oil and gold forecasts? Get them here to find out!
GOLD TECHNICAL ANALYSIS
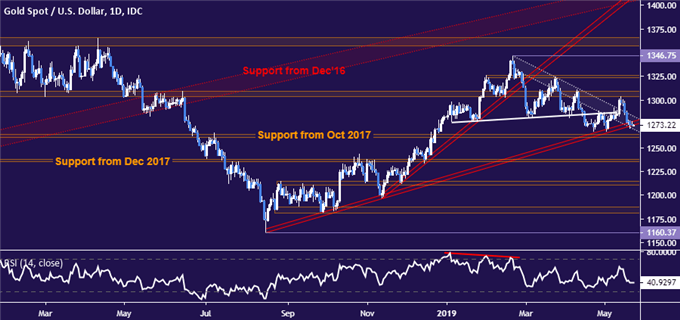
Gold prices are idling at rising trend line support set from August 2018. A daily close below this and the 1260.80-63.76 inflection area targets the 1235.11-38.00 zone next. Resistance is in the 1303.70-09.12 region, with a push above that eyeing the 1323.40-26.30 price band. February’s high at 1346.75 follows.

CRUDE OIL TECHNICAL ANALYSIS
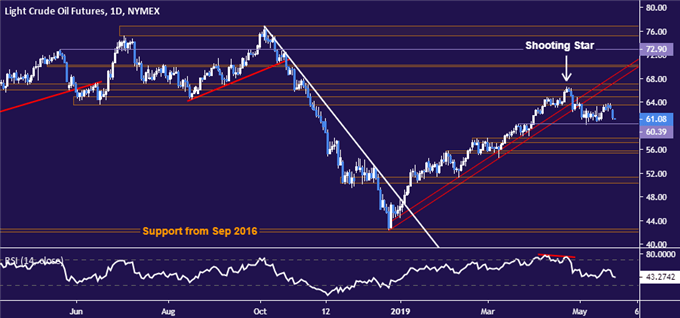
Crude oil prices recoiled from resistance, sinking toward range support at 60.39. A daily close below that opens the door for a test of the 57.24-88 area. On the topside, a dense layer of overlapping resistance levels runs from 63.59 to 67.03. A daily close above the upper boundary targets the $70/bbl figure next.

COMMODITY TRADING RESOURCES
- See our guide to learn about the long-term forces driving crude oil prices
- Having trouble with your strategy? Here’s the #1 mistake that traders make
- Join a free webinar to answer your commodity market questions
--- Written by Ilya Spivak, Currency Strategist for DailyFX.com
To contact Ilya, use the comments section below or @IlyaSpivak on Twitter


