


US Dollar Price Action Talking Points:
- The US Dollar has posed a mild bounce thus far after a bearish theme that’s developed in June. A set of comments yesterday from Jerome Powell and James Bullard sounded not-as-dovish as last week’s FOMC outlay, helping to continue that theme of a USD-pullback.
- Given the backdrop behind a series of major fx pairs, there could be differing degrees of strategy potential for themes around the US Dollar. Below I look at two setups on either side of the scenario.
- DailyFX Forecasts are published on a variety of markets such as Gold, the US Dollar or the Euro and are available from the DailyFX Trading Guides page. If you’re looking to improve your trading approach, check out Traits of Successful Traders. And if you’re looking for an introductory primer to the Forex market, check out our New to FX Guide.
US Dollar Bounces After Brutal Month of June
The US Dollar has finally found a bit of support after what had become a very bearish month of June. Last week’s dovish flip at the FOMC helped to further that theme as markets geared-up for the potential prospect of rate cuts out of the bank in the second-half of this year. That was buffered a bit, however, in some comments from FOMC Chair Jerome Powell yesterday. He alluded to the fact that the Fed was ‘grappling’ with the need for rate cuts, and this went along with James Bullard’s comments that seemed to rule out the prospect of a 50-basis point move.
The big question at this point is what yesterday’s less-dovish comments might do to the larger trend of USD-weakness that showed up in June. With the Q3 open now just a few trading days away, will bears be able to push down to fresh lower-lows? Or, are we sitting on the cusp of a return of bulls that were in-control of USD for much of the prior 14 months? Below I look at setups on either side of the scenario.
US Dollar Daily Price Chart
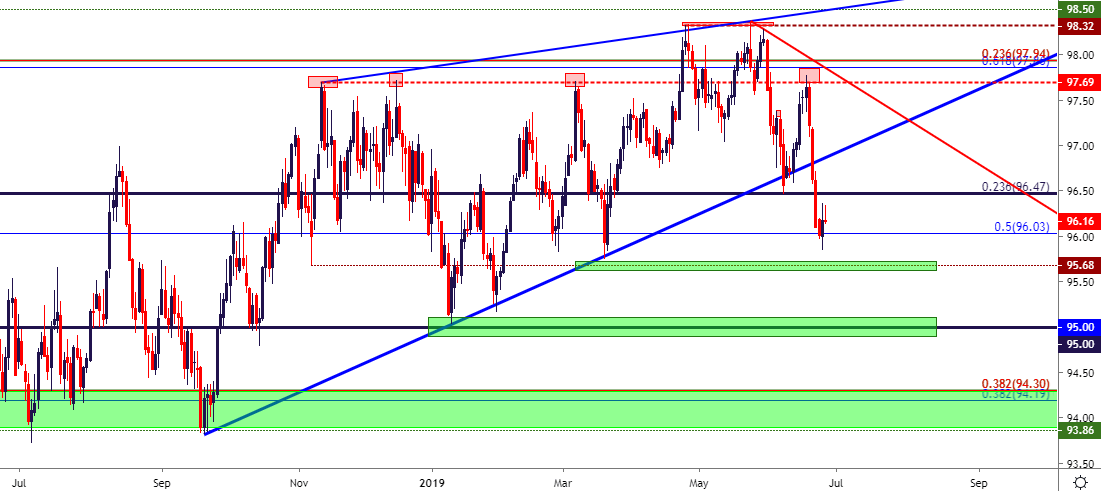
Chart prepared by James Stanley
EURUSD Pulls Back to Support After Fresh Two-Month-Highs
In response to last week’s USD-weakness, EURUSD pushed up to fresh two-month-highs. And to be sure, the European Central Bank isn’t exactly in a ‘more-hawkish’ position than the FOMC; but this seems to be a matter of the more recent driver (FOMC dovishness) getting the attention, combined with a short-squeeze scenario in EURUSD.
As looked at yesterday, higher-low support potential exists off of a zone of prior resistance, taken from the April and early-June swing highs that spans from around the 1.1325-1.1350 area on the chart. The topside of that zone has just started to come into play, and a hold of support here opens the door for topside continuation scenarios. Looking forward on the chart, the next zone of resistance exists in the 1.1448-1.1500 neighborhood, as this was resistance in the multi-month range in late-2018/early-2019.
EURUSD Eight-Hour Price Chart
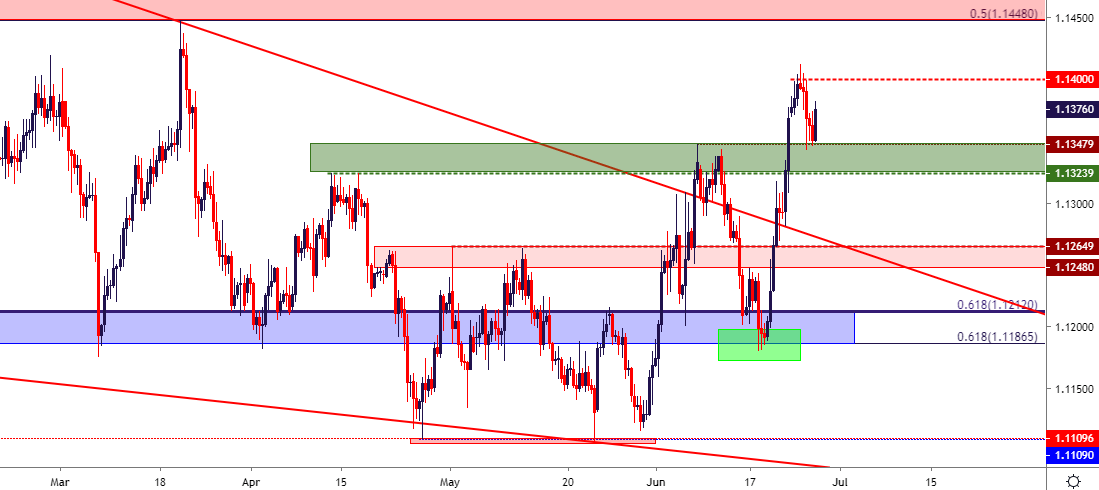
Chart prepared by James Stanley
GBPUSD: Cable Bounces Re-Tests Resistance
In contrast to last week’s bullish scenario in EURUSD, GBPUSD posed a bounce up to an area of resistance that has continued to help hold the highs. This takes place around the 1.2750 psychological level and this is the same area that’s restricted the advance since late-May. So, as that USD-weakness was getting priced-in, Cable sellers continued to show some element of defense around this key area on the chart.
This can also keep the pair as attractive for scenarios of USD-strength. If the Dollar is to pose a deeper bounce, the short-side of Cable can remain as attractive with focus on a re-test of the low around 1.2525. Alternatively, for traders that do not want to bet on a continued recovery in USD, pairs like GBP/JPY can remain as attractive for themes of GBP-weakness.
GBPUSD Daily Price Chart

Chart prepared by James Stanley
USDJPY Bounces After 107.00 Support Inflection
Back on the short-side of the US Dollar, USDJPY has been an area of focus for the past month. The pair has done a fairly decent job of reflecting risk tonalities this year; flying-higher through Q1 as equity markets ripped. And then posing a stutter-step in late-April/early-May as risk aversion reared its ugly head again. Where matters began to diverge, however, was in early-June, as those dovish comments from Chair Powell propelled stocks up to fresh all-time-highs while, seemingly, USD/JPY languished near support.
As I wrote yesterday, USDJPY appeared ripe for a pullback given the grind at support around the 107.00 target. That pullback has already started to show, and this puts emphasis on lower-high resistance potential around prior support. That zone comes-in around the 108.00-area, and a show of sellers here re-opens the door for short-side themes in the pair.
USDJPY Four-Hour Price Chart
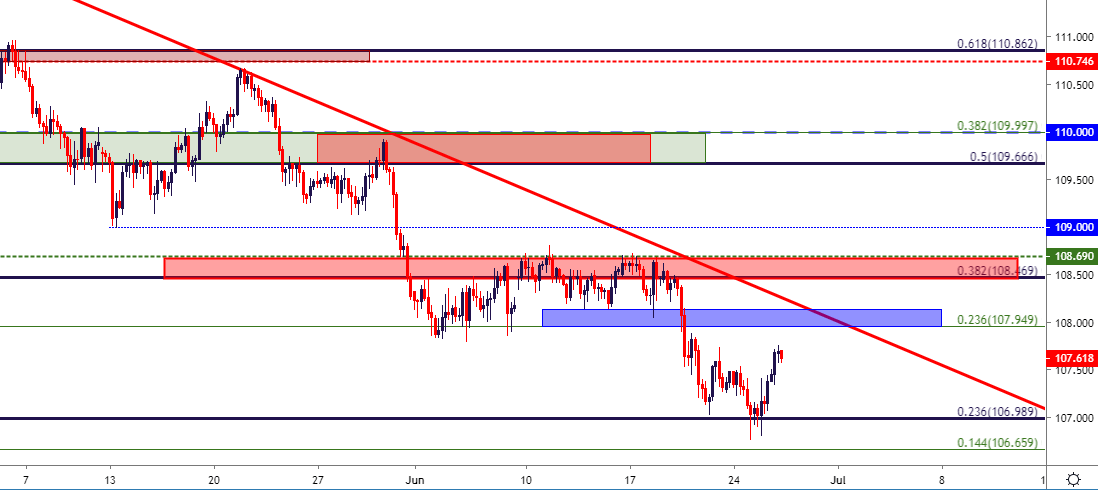
Chart prepared by James Stanley
AUDUSD Approaches Key Resistance
The Aussie has had an interesting month. Not only did the RBA cut rates to a record low of 125 basis points, but the pair has gained so far this month, including in the immediate aftermath of that rate decision. USD-pressures have surely taken-toll, and this is well-indicated by the fact that the ‘rate cut rally’ pushed prices up to a key area of resistance; and as USD bounced in the second week of June, sellers made their mark in the Australian Dollar.
This swing happened at a key area on the chart that spans from the .7000 big figure up to the .7019 Fibonacci level. I had looked at this level for short-side swings earlier in the month, and this has so far helped to hold the monthly high in the pair. I started looking for resistance again in AUDUSD this week, plotting from around the .6960 area on the chart but that’s since been unable to hold the highs. So, focus goes right back to the .7000-.7019 area for lower-high resistance potential. This keeps the pair as attractive for themes of USD-strength.
AUDUSD Four-Hour Price Chart
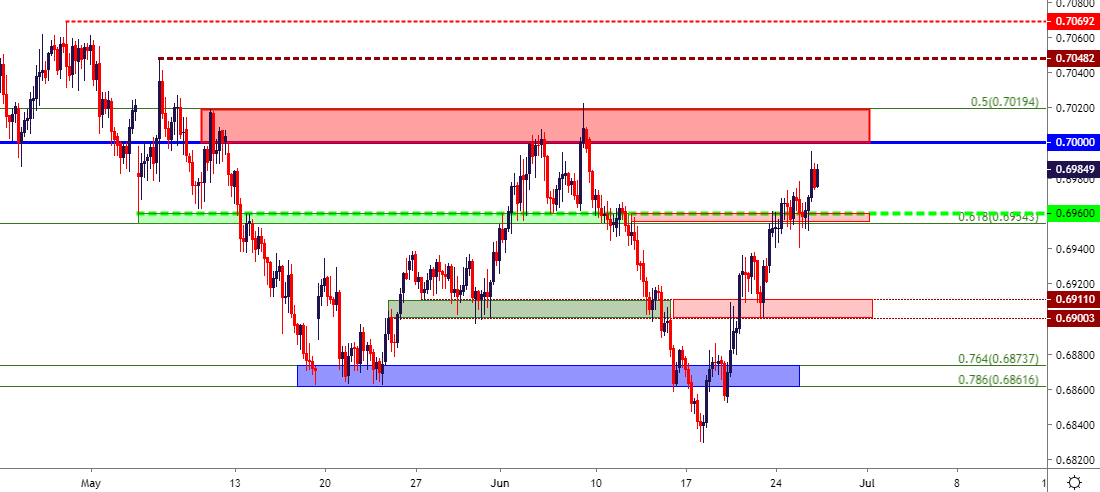
Chart prepared by James Stanley
To read more:
Are you looking for longer-term analysis on the U.S. Dollar? Our DailyFX Forecasts have a section for each major currency, and we also offer a plethora of resources on Gold or USD-pairs such as EUR/USD, GBP/USD, USD/JPY, AUD/USD. Traders can also stay up with near-term positioning via our IG Client Sentiment Indicator.
Forex Trading Resources
DailyFX offers an abundance of tools, indicators and resources to help traders. For those looking for trading ideas, our IG Client Sentiment shows the positioning of retail traders with actual live trades and positions. Our trading guides bring our DailyFX Quarterly Forecasts and our Top Trading Opportunities; and our real-time news feed has intra-day interactions from the DailyFX team. And if you’re looking for real-time analysis, our DailyFX Webinars offer numerous sessions each week in which you can see how and why we’re looking at what we’re looking at.
If you’re looking for educational information, our New to FX guide is there to help new(er) traders while our Traits of Successful Traders research is built to help sharpen the skill set by focusing on risk and trade management.
--- Written by James Stanley, Strategist for DailyFX.com
Contact and follow James on Twitter: @JStanleyFX


