
200 bar MA on 4 hour chart, 50% of last run higher, and rising 100 hour MA
The GBPUSD ran to the highest level since May 21 to 1.27826 today, but has since backed off and has just traded to new session lows at 1.2717. That is right at the 200 bar MA on the 4-hour chart (at 1.27177). The 50% of the last run higher comes in at 1.27121. The rising 100 hour MA is at 1.27064.
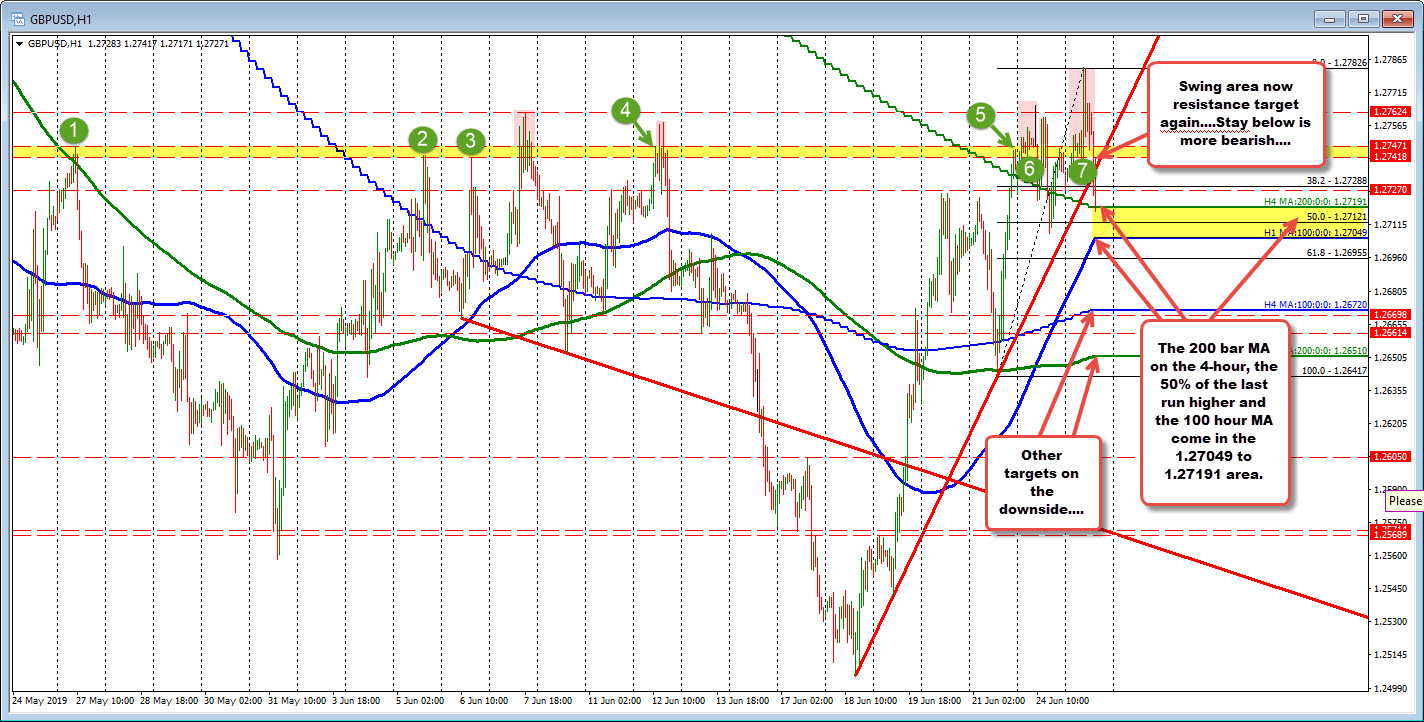
That cluster of levels (from 1.27064 to 1.27177) are the next targets in what may be another failed run above the 1.27418 to 1.27471 area (upper yellow area). That area was initially defined on May 27 and June 5 and June 6. Since then, the pair has had periodic runs higher (red shaded areas, including the run higher today) only to back off. For sellers/bears, staying below that area will be eyed now for topping clues.
What is in the favor of buyers, however, is the run higher was pretty steep. There was a lot of interest that took the price from 1.2505 on June 18, to 1.27826 in 6 trading days. It is tough to shake that bullish run out of the market. It also leaves lots of potential support levels on the correction lower.
As a result, traders will be watching the target levels below to see that a bearish progression can be maintained. They will also be eyeing key levels broken above as well.
Right now the sellers are making a play today, but they are heading into the first cluster of support which could slow the fall.

