


FTSE 100 Technical Highlights:
- FTSE 100 trading at trend-line off record high
- Price action suggests it may break on through soon
Forecasts and educational content can be found on the DailyFX Trading Guides page.
FTSE 100 trading at trend-line off record high
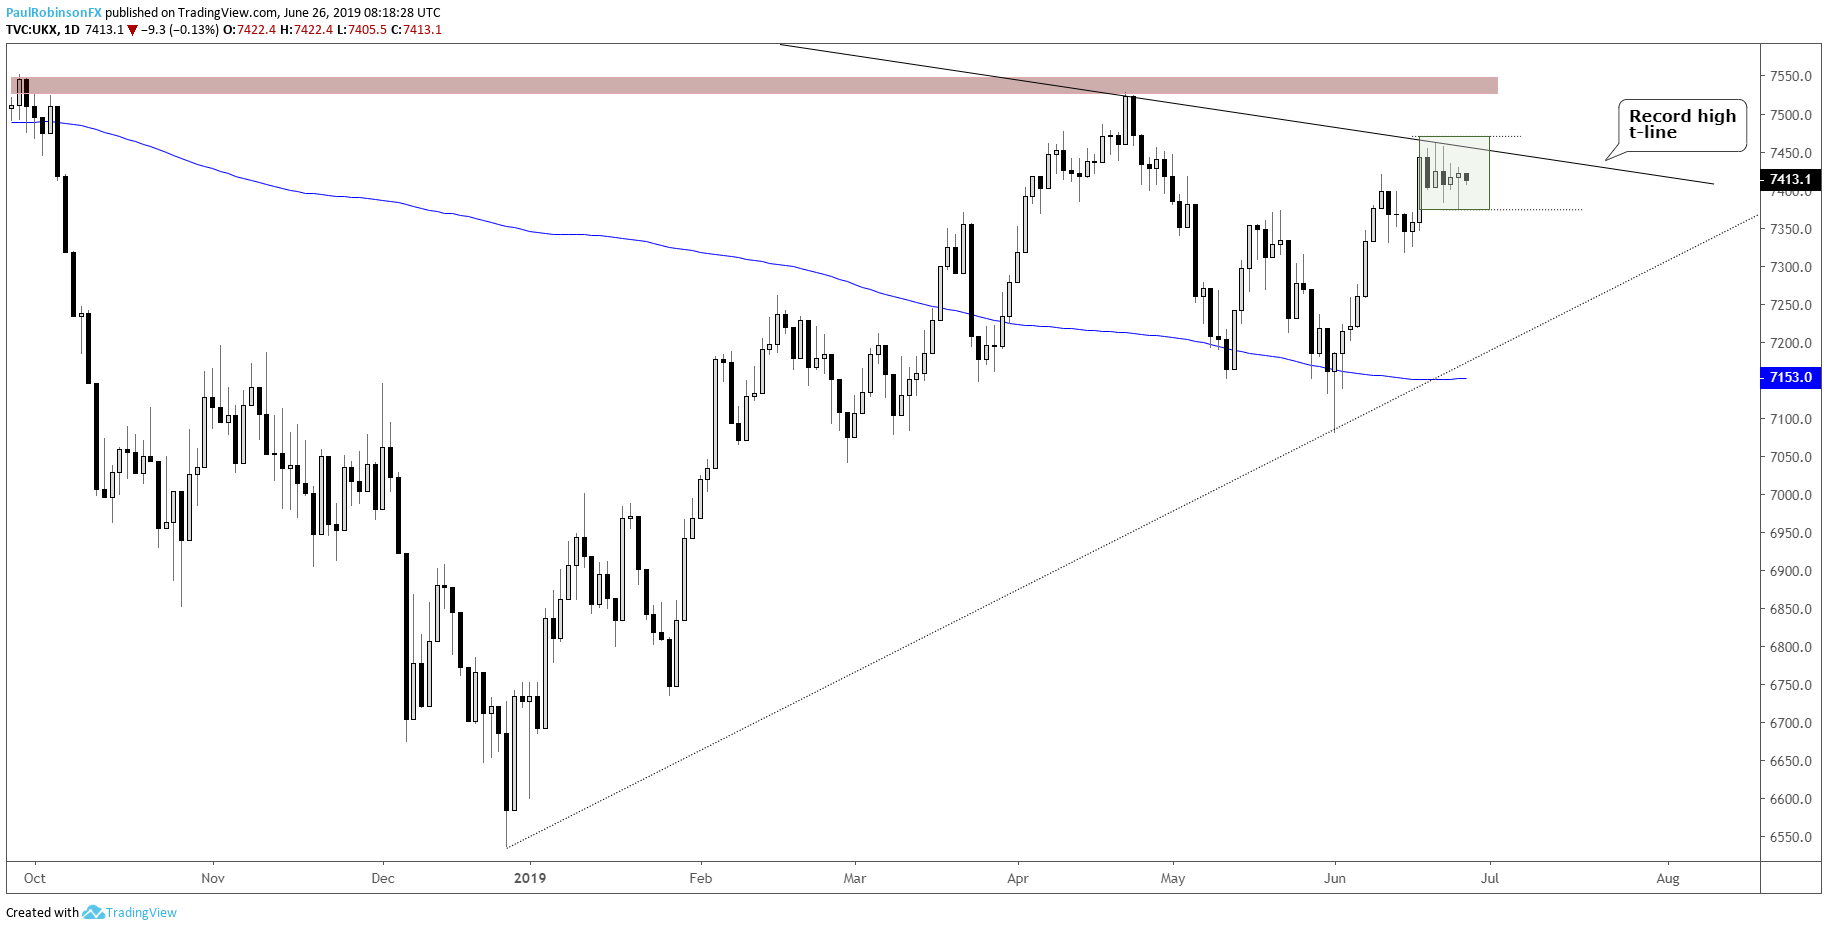
The FTSE 100 is currently trading at the trend-line running lower off the record high created over a year ago, resistance that has kept a lid on price rising the past few sessions. The consolidating nature of recent price action suggests we will soon see a breakout.
A close above 7469 will help cement a breakout and have the FTSE moving on towards the next row of resistance; 7528/552 will be next up to overcome, followed by 7600+. But resistance is resistance until it’s not even if price action is generally favorable for a breakout. A close above is the key.
In the event we see a downturn through yesterday’s low at 7373, then selling may increases as the consolidation phase begins to get compromised. The next level of support in the event of selling will be 7316, followed by the trend-line from December if things begin to accelerate.
All-in-all, things are looking up for the FTSE, we just need to see a breakout develop first.
Check out this guide for 4 ideas on how to Build Confidence in Trading.
FTSE Daily Chart (consolidating below t-line)
You can join me every Wednesday at 9 GMT for live analysis on equity indices and commodities, and for the remaining roster of live events, check out the webinar calendar.
Tools for Forex & CFD Traders
Whether you are a beginning or experienced trader, DailyFX has several resources available to help you; indicator for tracking trader sentiment, quarterly trading forecasts, analytical and educational webinars held daily, trading guides to help you improve trading performance, and one specifically for those who are new to forex.
---Written by Paul Robinson, Market Analyst
You can follow Paul on Twitter at @PaulRobinsonFX


