


USD/CHF Price Outlook, Charts and Analysis
- EURO and US Dollar looking ahead to highly important data release tomorrow.
- USD/CHF and EUR/CHF price action.
Find out more about EUR and USD price outlook through mid-year, download for free Q2 major currencies forecasts
EUR and USD Trading Lower Against CHF
Since May 10, a bearish move sent EUR/CHF to its lowest level in nearly 11 months at 1.1057 losing 1.0% of its value. Alongside, USD/CHF lost approximately 4.0% printing yesterday its lowest level in nine months at 0.9694.
Today, the Relative Strength index (RSI) reading in both pairs is at 30 nearby the oversold territory, reflecting the sellers are still in charge.
Just getting started? See our Beginners’ Guide for FX traders
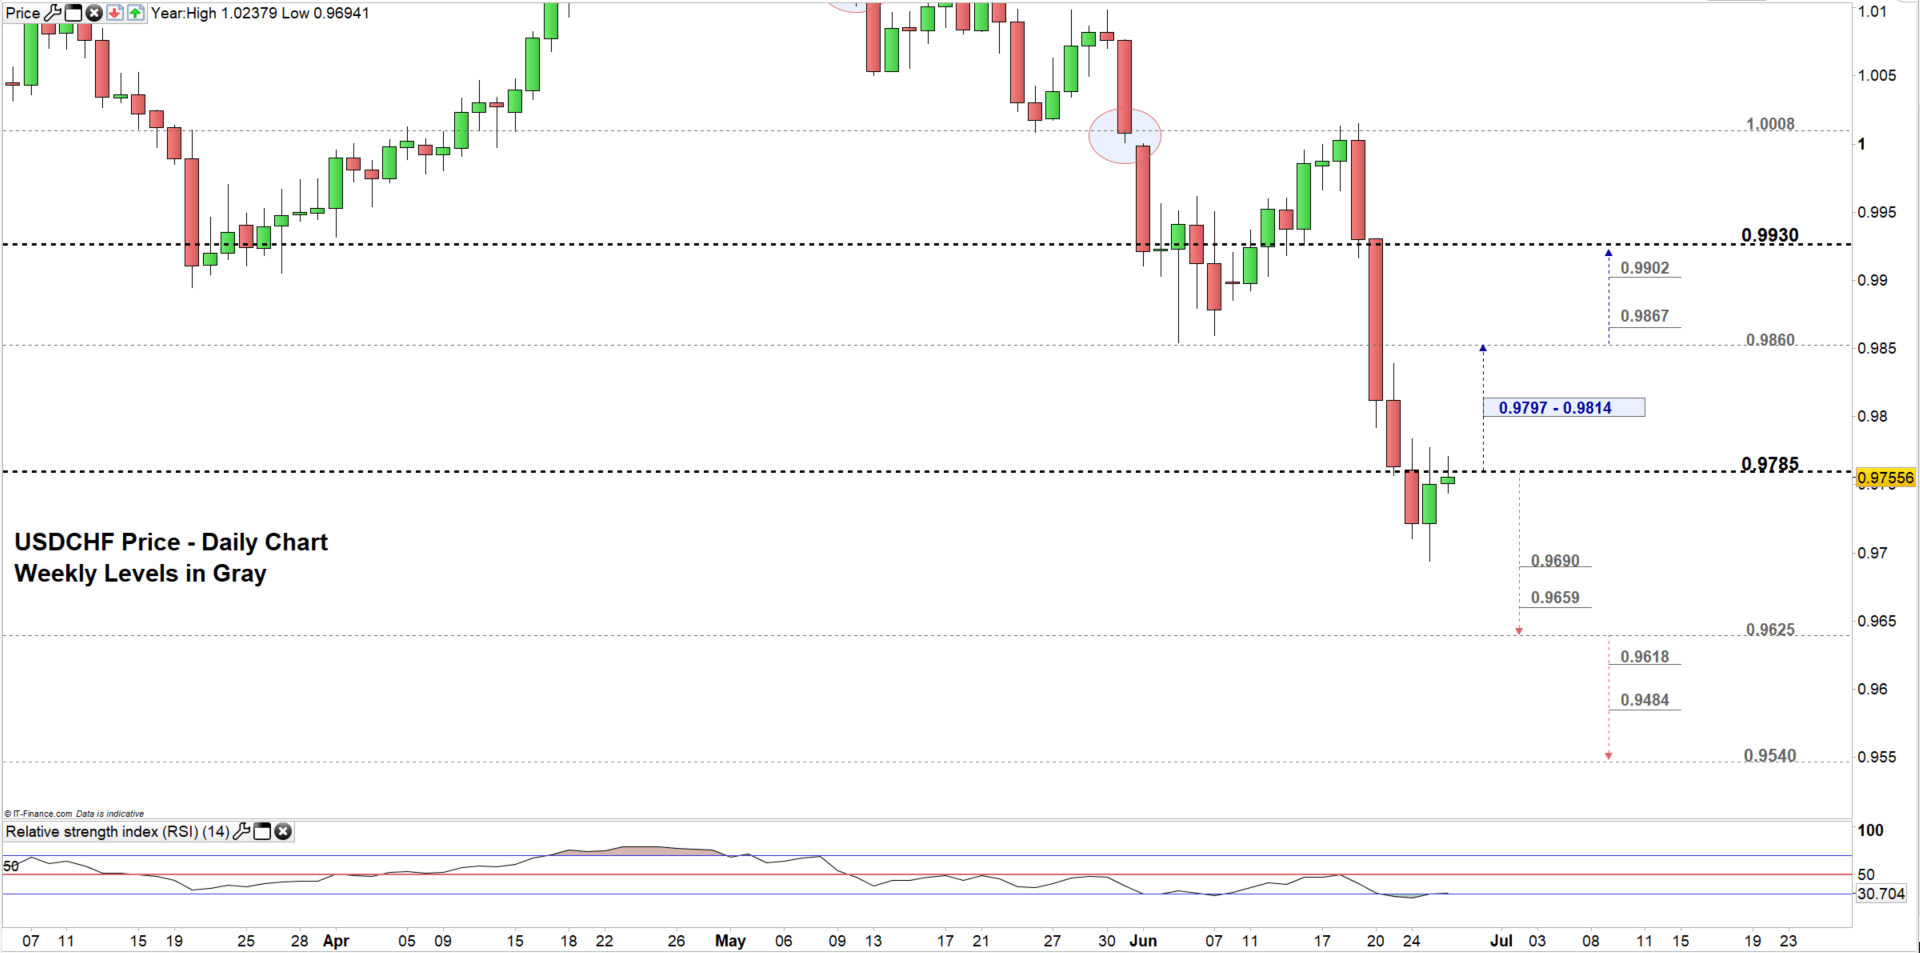
USD/CHF Daily Price Chart (MAR 1, 2019 - June 26, 2019) Zoomed in
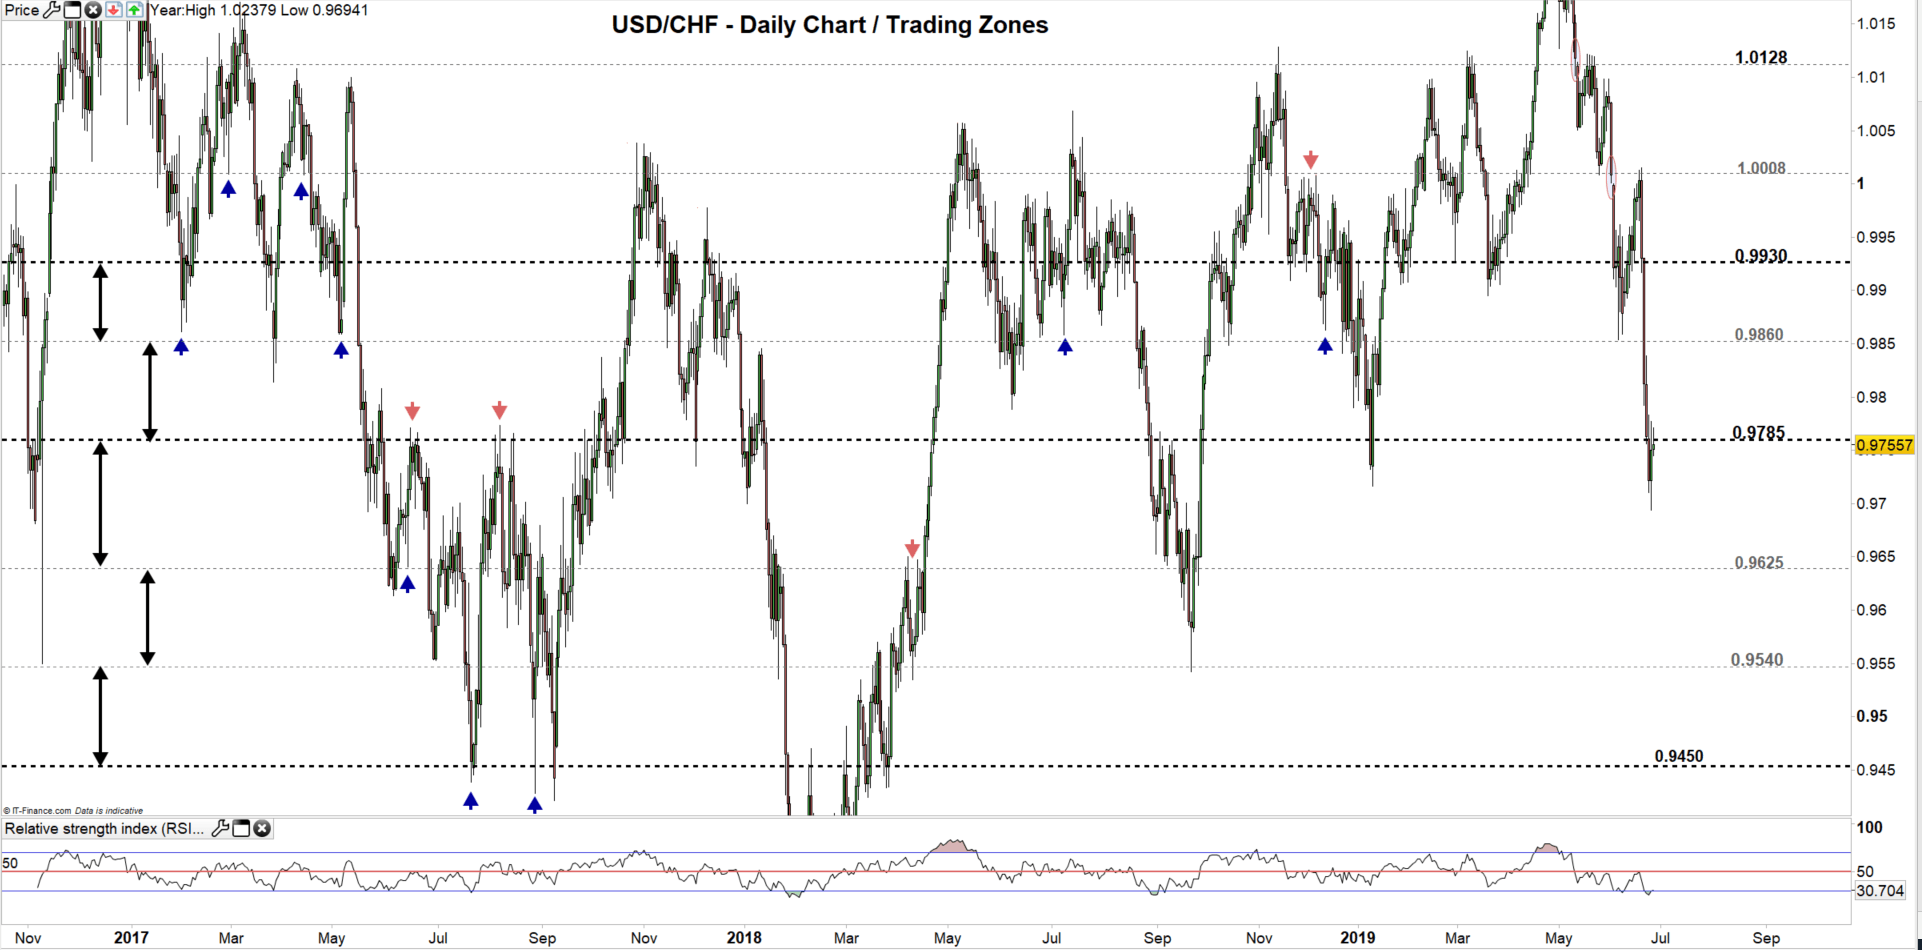
USD/CHF Daily Price Chart (Oct 5, 2016 – June 26, 2019) Zoomed Out
Looking at the Daily chart, we notice that USD/CHF closed on June 24 below the levels discussd in our pervious update at 0.9785 and failed yesterday to close above, eying a test of 0.9625 although, the weekly supports underlined on the chart need to be considered.
Further bearish momentum may require a close below 0.9625. This mean USD/CHF could head towards 0.9540. See the chart to find out more about the weekly support levels to be watched along the way.
In turn, a close above 0.9785 might lead USD/CHF towards 0.9860. Nonetheless, the weekly resistance zone from 0.9797 up to 0.9814 should be kept in focus. See the chart for more details if the rally continues beyond 0.9860.
Having trouble with your trading strategy? Here’s the #1 Mistake That Traders Make
EUR/CHF Daily Price Chart (Feb 26, 2019 – June 26, 2019) Zoomed in

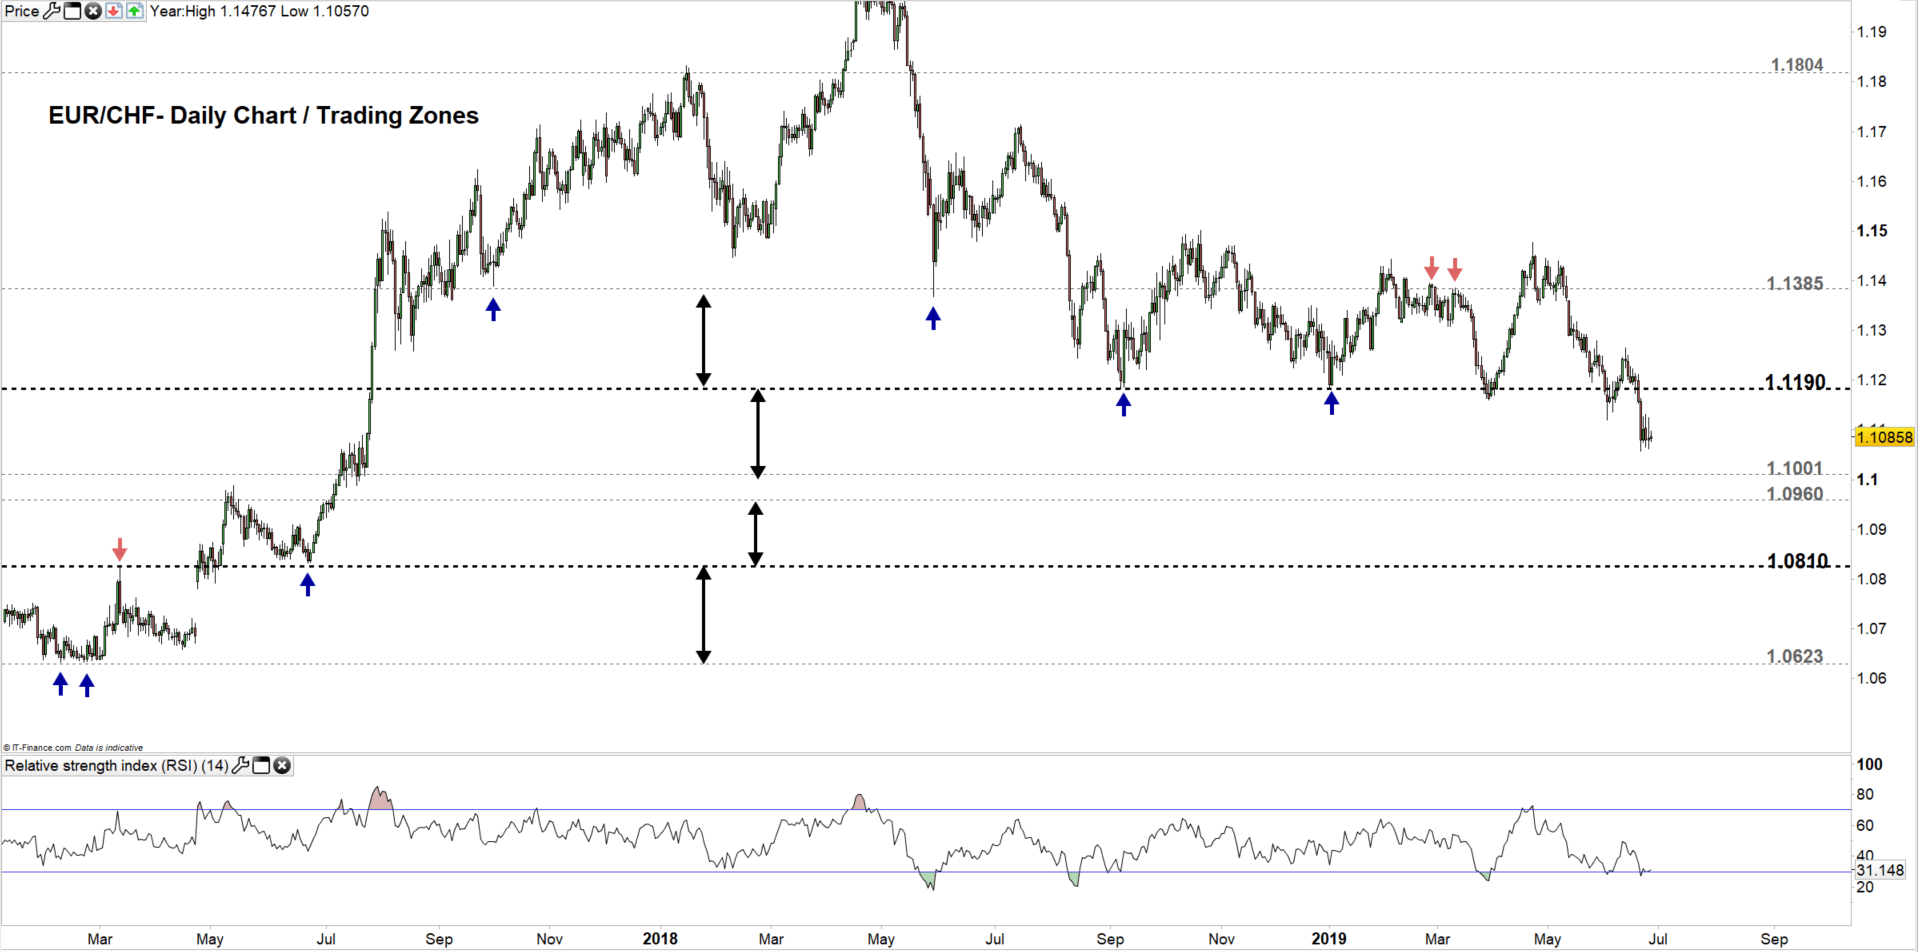
EUR/CHF Daily Price Chart (Jan 10, 2017 – June 26, 2019) Zoomed Out
Looking at the Daily chart, we notice that EUR/CHF closed on June 19 below 1.1190 eying a test of 1.1001. On the following day, the price found support at 1.1057 pausing the bearish move. The price rallied yesterday however, closed with a bearish Doji. See the chart to find out about the key levels if the price rallies towards 1.1190 and above.
A continuation of the bearish trend might require EUR/CHF to close below 1.1057. This could see the pair trading towards 1.1001 although, the weekly support at 1.1023 would be worth monitoring. A close below 1.1001 could pave the way towards 1.0960. See the chart to know more about the weekly support to be watched.
Written By: Mahmoud Alkudsi
Please feel free to contact me on Twitter: @Malkudsi


