


Dow Jones, Nasdaq 100, DAX 30, FTSE 100 Technical Forecast:
- The Dow Jones is trading within grasp of all-time highs and nearby support will look to keep it afloat
- The Nasdaq 100 has a laundry list of earnings to watch next week which could spur volatility and see the tech-heavy Index threaten critical support
- Interested in equity markets? Sign up for the Weekly Stock Market Outlook Webinar.
Dow Jones, Nasdaq 100, DAX 30, FTSE 100 Technical Forecast
The Dow Jones and Nasdaq 100 will look to ride the wave of volatility brought about by earnings season. Likely to be the dominant theme of the week, earnings can result in significant after-hours price moves which could see the Indices gap through important technical levels or result in another currency flash crash. That said, traders should be wary of daily closes near technical levels because they can be disposed of readily in the lower-volume trading hours.
Dow Jones Technical Forecast
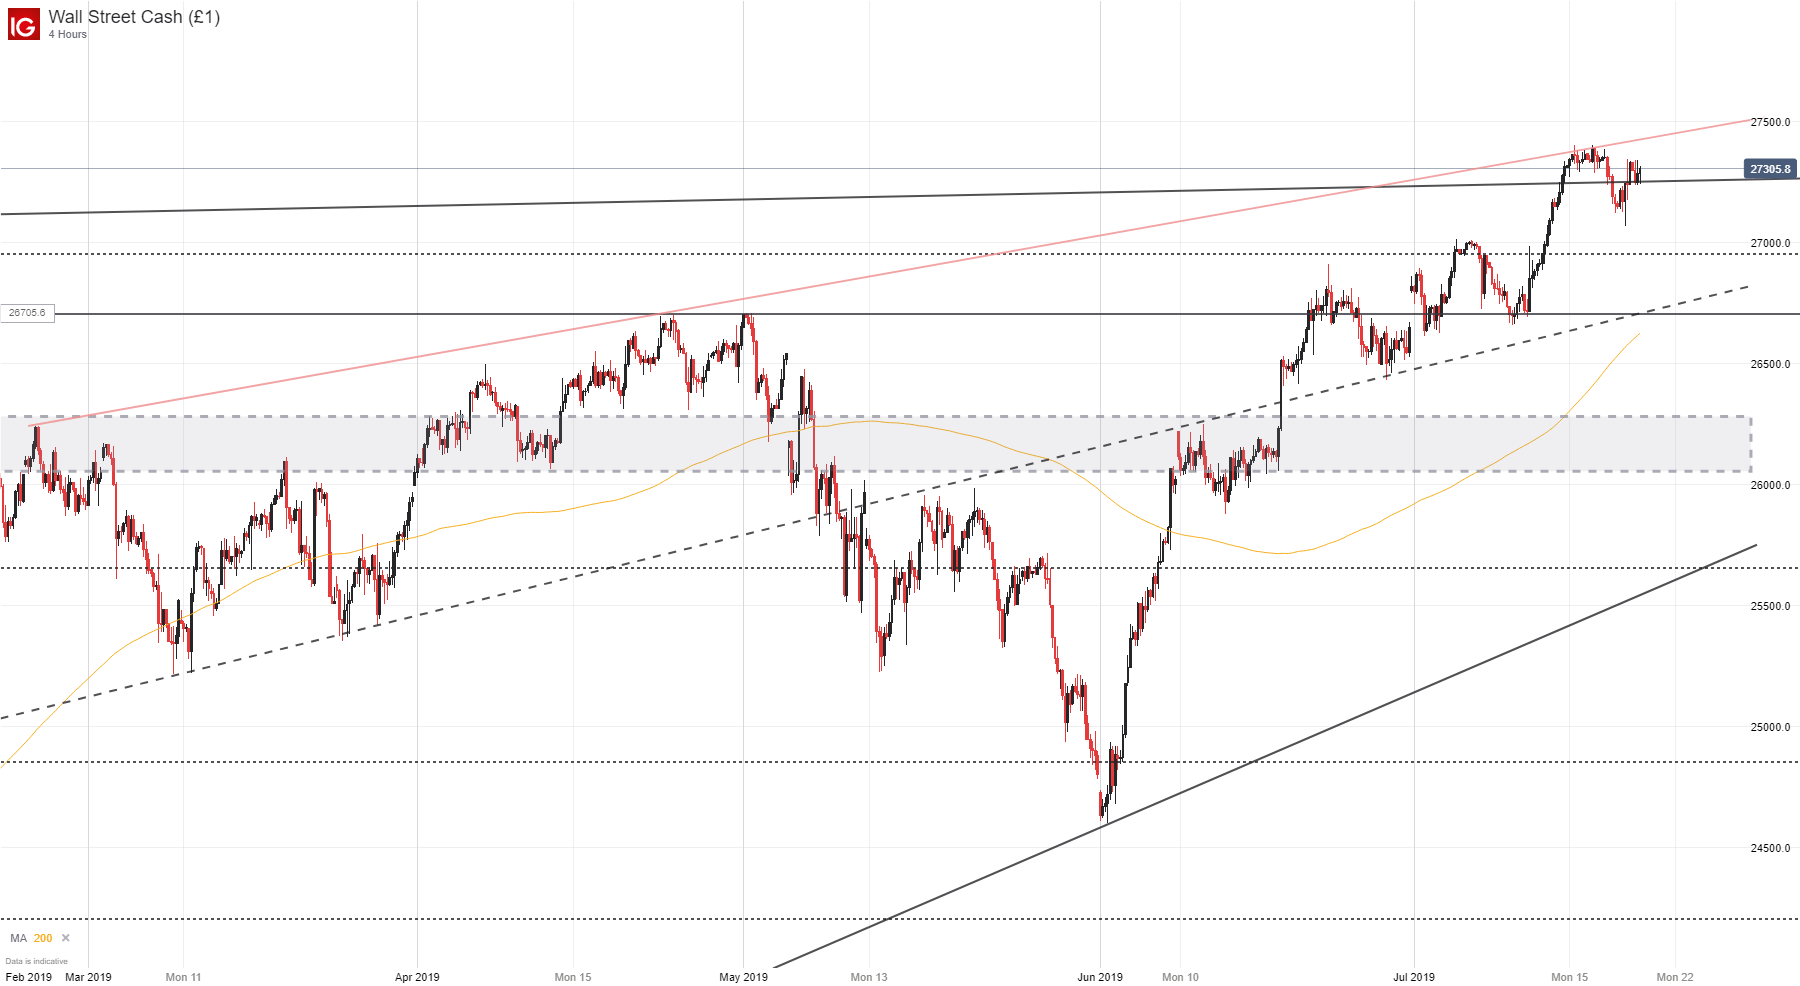
The Dow Jones is within reach of all-time highs around 27,400 but nearby resistance could look to hold the Industrial Average in check. The ascending trendline marked by highs in February and April refuted price early last week but consolidation and an encouraging fundamental backdrop could see the level break upon renewed attempts. Immediate support may be enjoyed at the 27,260 level but its proximity to Friday’s close is concerning. Consequently, potential support at the 26,945 and 26,705 levels should be looked to if the initial zone succumbs to selling pressure.
Dow Jones Price Chart: 4 - Hour Time Frame (February – July) (Chart 1)
Nasdaq 100 Technical Forecast
The tech-heavy Nasdaq will look to a series of tech earnings including key FAANG member s. With that in mind, the Index could experience heightened volatility and fluctuate wildly between areas that enjoy technical merit. Topside resistance is sparse, marked by the recent record high at 7,970. Secondary resistance will likely be posed by the 8,000 psychological level.
Nasdaq 100 Price Chart: 4 – Hour Time Frame (May – July) (Chart 2)

On the other hand, the Nasdaq 100 will look for support from an area of confluence around 7,860. Should initial support break, secondary support may reside around the 7,720 level where the 200-day moving average is on the 4-hour chart. Further, the area has proved buoyant in the past – evidenced by price action in early July.
Check out our NEW Q3 Forecasts for equities, Gold, oil and more.
DAX 30 Technical Forecast
After falling out of an ascending channel, the DAX 30 has broken through multiple levels of subsequent support. Now, the Index looks to test a final level of nearby support around 12,200. Should the horizontal support fail, secondary resistance around 12,050 may come into play. After bleeding lower during July, the DAX may look to consolidate around the ascending trendline beneath before resuming its climb higher.
DAX 30 Price Chart: 4 – Hour Time Frame (June - July) (Chart 3)
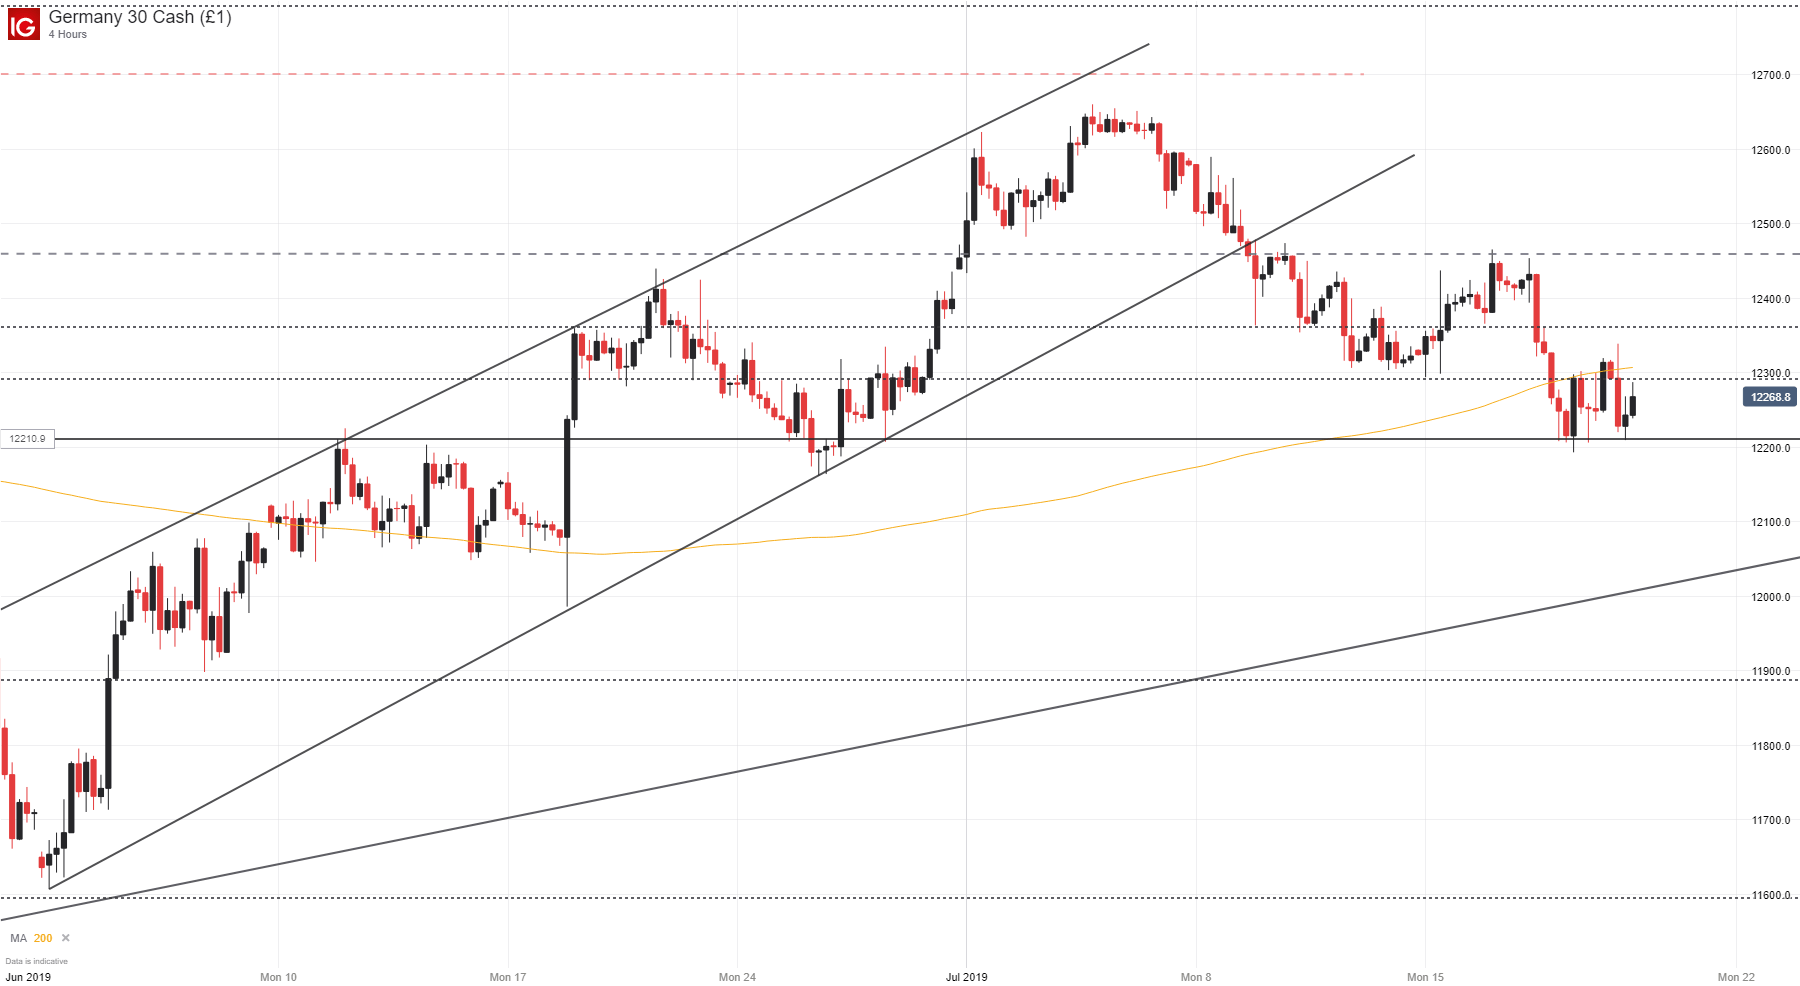
That said, a rebound will have to wrestle with four areas of resistance – each with varying degrees of influence. The most important is arguably the 200-day moving average on the 4-hour chart followed by horizontal resistance around 12,460. I maintain a bullish bias on the DAX and a test – followed by a subsequent rebuttal - of the ascending trendline beneath could be constructive for the interests of longer-term trend continuation.
FTSE 100 Technical Forecast
The FTSE 100 also looks to threaten a nearby trendline from late 2018. The line has guided the Index higher throughout 2019 and a break beneath could open the door to further losses. To that end, the 200-day moving average will look to work in conjunction with the trend and rebuke a move lower. Should both support levels break, the FTSE could quickly trade down to tertiary support around 7,370.
FTSE 100 Price Chart: 4 – Hour Time Frame (June – July) (Chart 4)

Resistance is relatively thin, with two potential levels at 7,572 and 7,621 an area marked by recent highs in early July. As the week progresses and price action unfolds, follow @PeterHanksFX on Twitter for technical updates and fundamental analysis.
--Written by Peter Hanks, Junior Analyst for DailyFX.com
Contact and follow Peter on Twitter @PeterHanksFX
Read more: Will the Stock Market Crash in 2019?
DailyFX forecasts on a variety of currencies such as the US Dollar or the Euro are available from the DailyFX Trading Guides page. If you’re looking to improve your trading approach, check out Traits of Successful Traders. And if you’re looking for an introductory primer to the Forex market, check out our New to FX Guide.


