Our researchers have identified a very rare type of price pattern that is typically associated with explosive trend changes and trends. We call this type of pattern a “Sandwich” pattern because of how price reacts within a range. The small-cap ETF IWM is illustrating a nearly perfect example of this pattern right now.
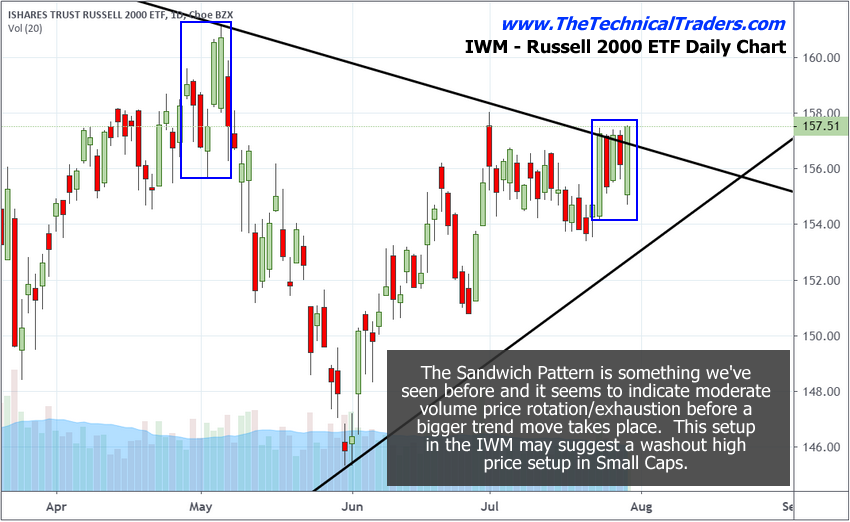
The close-up view of the daily IWM chart highlights the Sandwich pattern over the most recent 5 trading days and shows how price enters this volatile period, rotates around within a range, then settles near the upper or lower end of the range before a price breakout occurs. Notice the earlier Sandwich pattern set-up and how price settled near the bottom of the range before a downside price leg pushed the price much lower.
It is our belief that the IWM could be setting up for a significant reversal or breakout based on this Sandwich pattern so be ready for an extended move.

A Longer-Term View
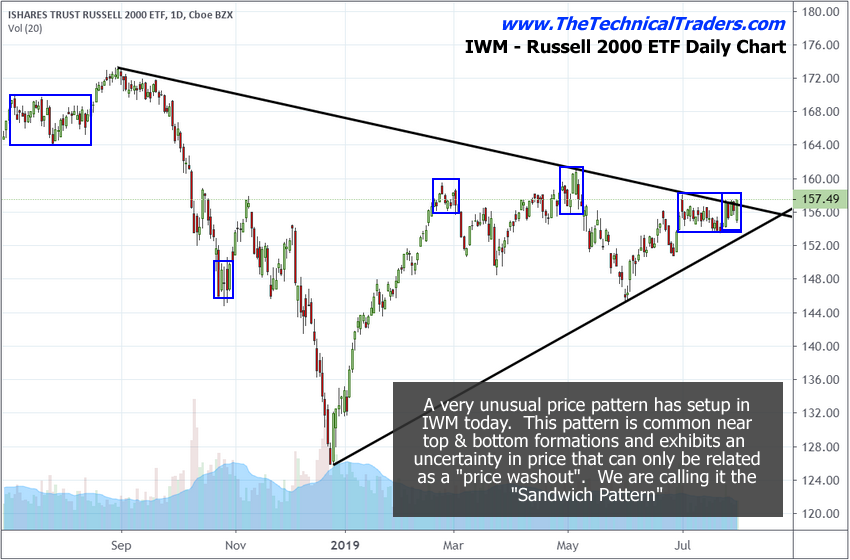
Here is a longer-term look at the IWM, which highlights previous Sandwich patterns for you to review. We go into more detail and a very interesting set-up in the IWM and transportation index, which took place in 2008 – same set up we see now. See charts and report here.

One thing to understand about the Sandwich pattern is that it is an early warning sign that price has reached an inflection point and will likely attempt to break out or reverse down from the ranges set-up within the Sandwich pattern.
Also, you can see from the examples above, these patterns can take many bars to form and are sometimes somewhat convoluted in structure. The most recent Sandwich pattern is unique because it is has defined over the past 5+ days. We believe an upside price pop to the upside could turn into a “washout high” price set-up.
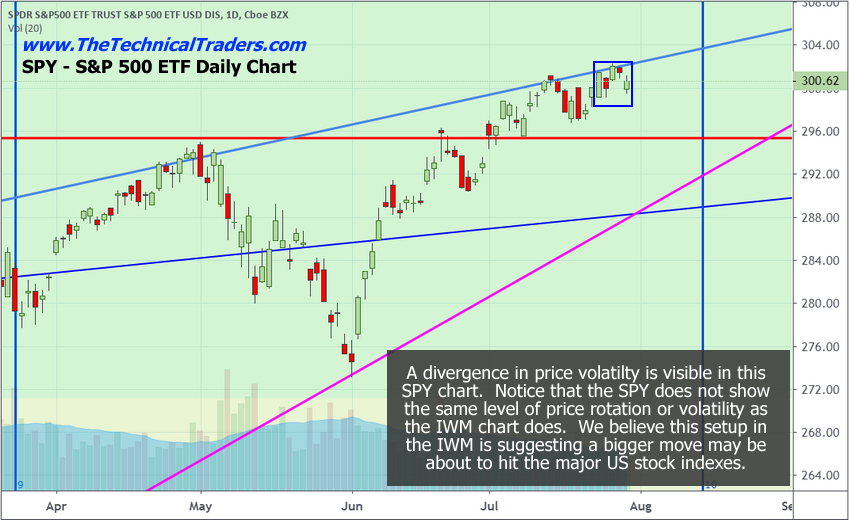
Compare this price activity to the SPY (NYSE:SPY) chart and you’ll see that the small caps are operating as a leading price indicator for the potential breakout/breakdown move that may happen in the immediate future. We see similar types of price rotation, but nothing as clear as we see on the IWM chart.

The fed news is shaking things up and our analysis stats this month could be the market top. We expect Aug 19th-ish… but this month is the window we feel it may happen. Stay tuned to our research – this is going to be fun to trade.
Warning Signs About Gold, Silver, Miners And The S&P 500
In early June I posted a detailed video showing the bottoming formation in gold and where to spot the breakout level. I also talked about crude oil reaching its upside target after a double bottom and I called the short-term top in the S&P 500 index. This was one of my pre-market videos for members. Watch Video Here.
I then posted a detailed report talking about where the next bull and bear markets are and how to identify them. This report focused mainly on the S&P 500 index and the gold miners index. My charts compared the 2008 market top and bear market along with the 2019 market prices today. See Comparison Charts Here.
On June 26 I said that silver was likely to pause for a week or two before it took another run up on June 26. This played out perfectly as well and silver is now headed up to our first key price target of $17. See Silver Price Cycle and Analysis.
More recently on July 16, I warned that the next financial crisis (bear market) was scary close, possibly just a couple weeks away. The charts I posted will make you really start to worry. See Scary Bear Market Setup Charts.
Concluding Thoughts
In short, you should be starting to get a feel of where each commodity and asset class is headed for the next 8+ months. The next step is knowing when and what to buy and sell as these turning points take place, which is the hard part.
