


GBP/JPY and USD/JPY Forecast
- US Dollar and British Pound against Japanese Yen Charts and analysis.
Download for free our latest Q3 trading guides to help you build confidence when you trade on JPY, USD and other main currencies
GBP/JPY – USD/JPY- Indecisive Traders
Last week GBP/JPY tested 126.55 - its lowest levels in closed in over two and half years however, the pair reversed direction then closed in the green for the first time in six weeks. Similarly, USD/JPY tested its lowest level at 105.05 then U -turned after, closing the weekly candlestick with 0.6% profit.
This week GBP/JPY corrected higher creating a higher high at 129.67, in turn USD/JPY needs to close today’s candlestick above 106.17 to create a higher low.
The Relative Strength Index (RSI) remained flat around 40 on GBP/JPY reflecting the market’s indecision, with the seller’s loss of momentum and the buyer’s lack of impulse to start uptrend move. The oscillator stuck around 46 on USD/JPY highlighting similar hesitation in the market.
Just getting started? See our Beginners’ Guide for FX traders
GBP/JPY DAILY PRICE CHART (DEC 15, 2016 – AUG 22, 2019) Zoomed out

GBP/JPY DAILY PRICE CHART (April 15 – AUG 22, 2019) Zoomed IN
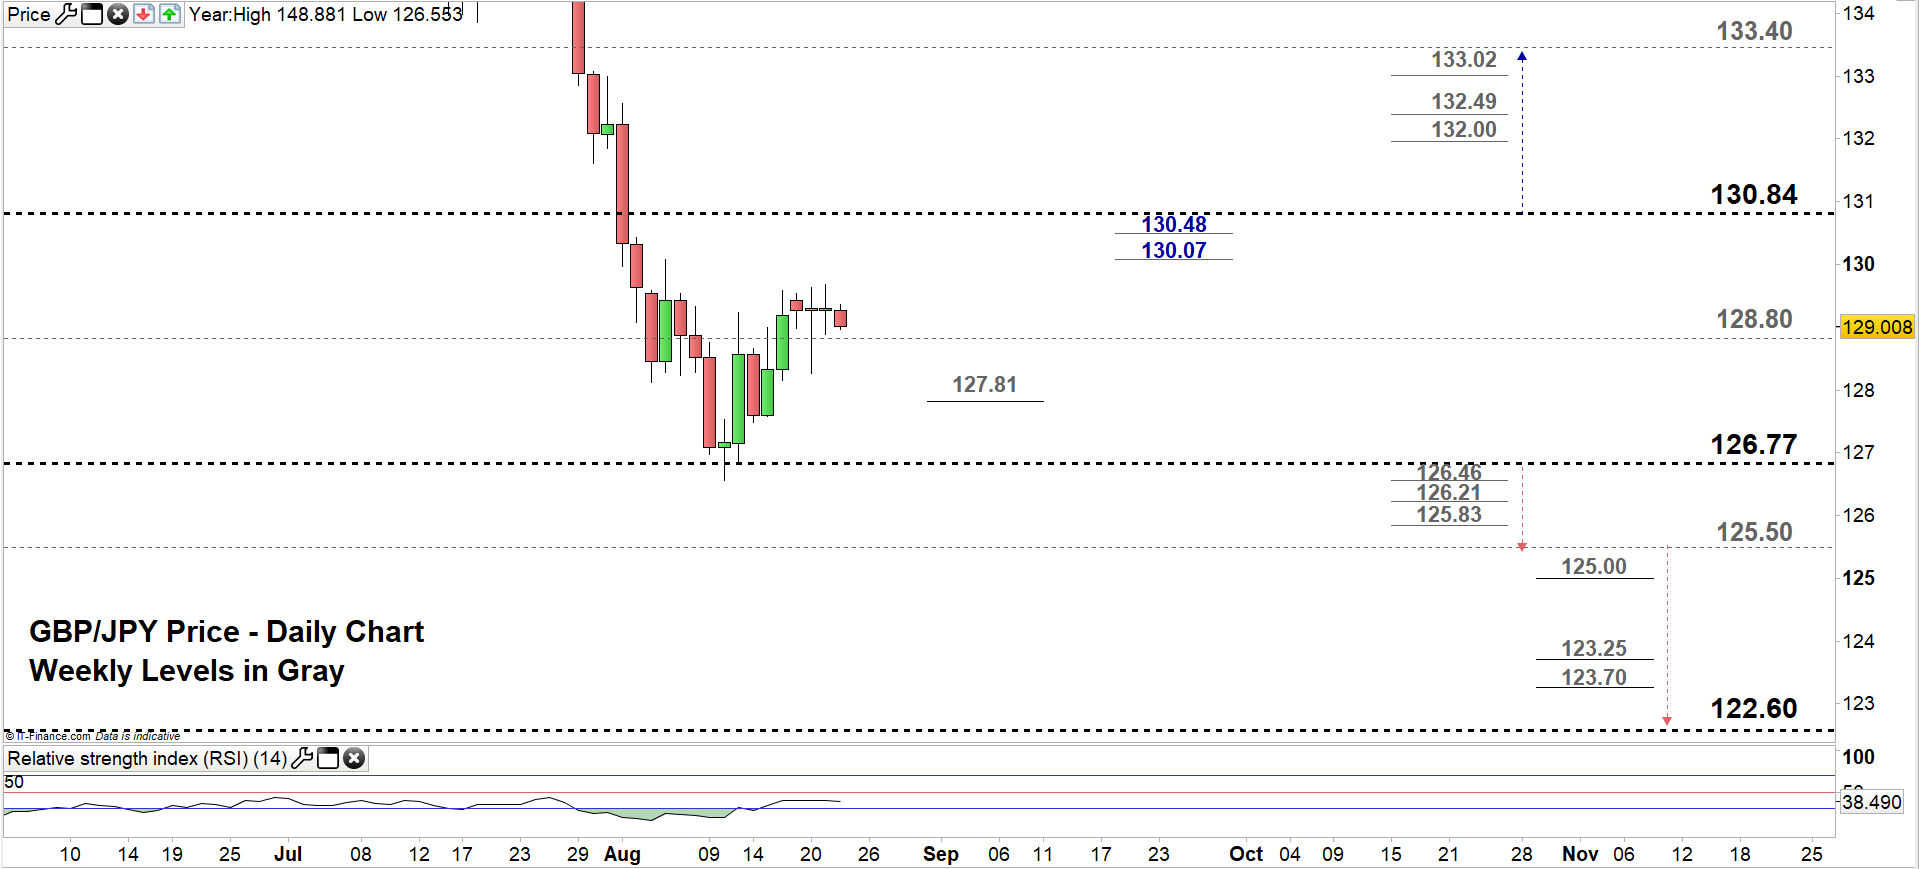
Looking at the daily chart, we notice on Friday GBP/JPY climbed to the higher trading zone 128.80 – 130.84 albeit, the pair has been trading ineffectively since the start of this week. Any rally towards the high end needs to consider the daily resistance levels underlined on the chart.
Hence, a close above the high end of the zone could push GBPJPY towards 133.40 although, the weekly resistance levels marked on the chart should be followed along the way.
On the flip-side any close below the low end of the zone could send GBPJPY towards 126.77 nonetheless, the weekly support levels underscored on the chart (Zoomed in) would be worth monitoring. See the chart to know more about the lower trading zone/s with the weekly support levels sellers would face in a further bearish move.
Having trouble with your trading strategy? Here’s the #1 Mistake That Traders Make
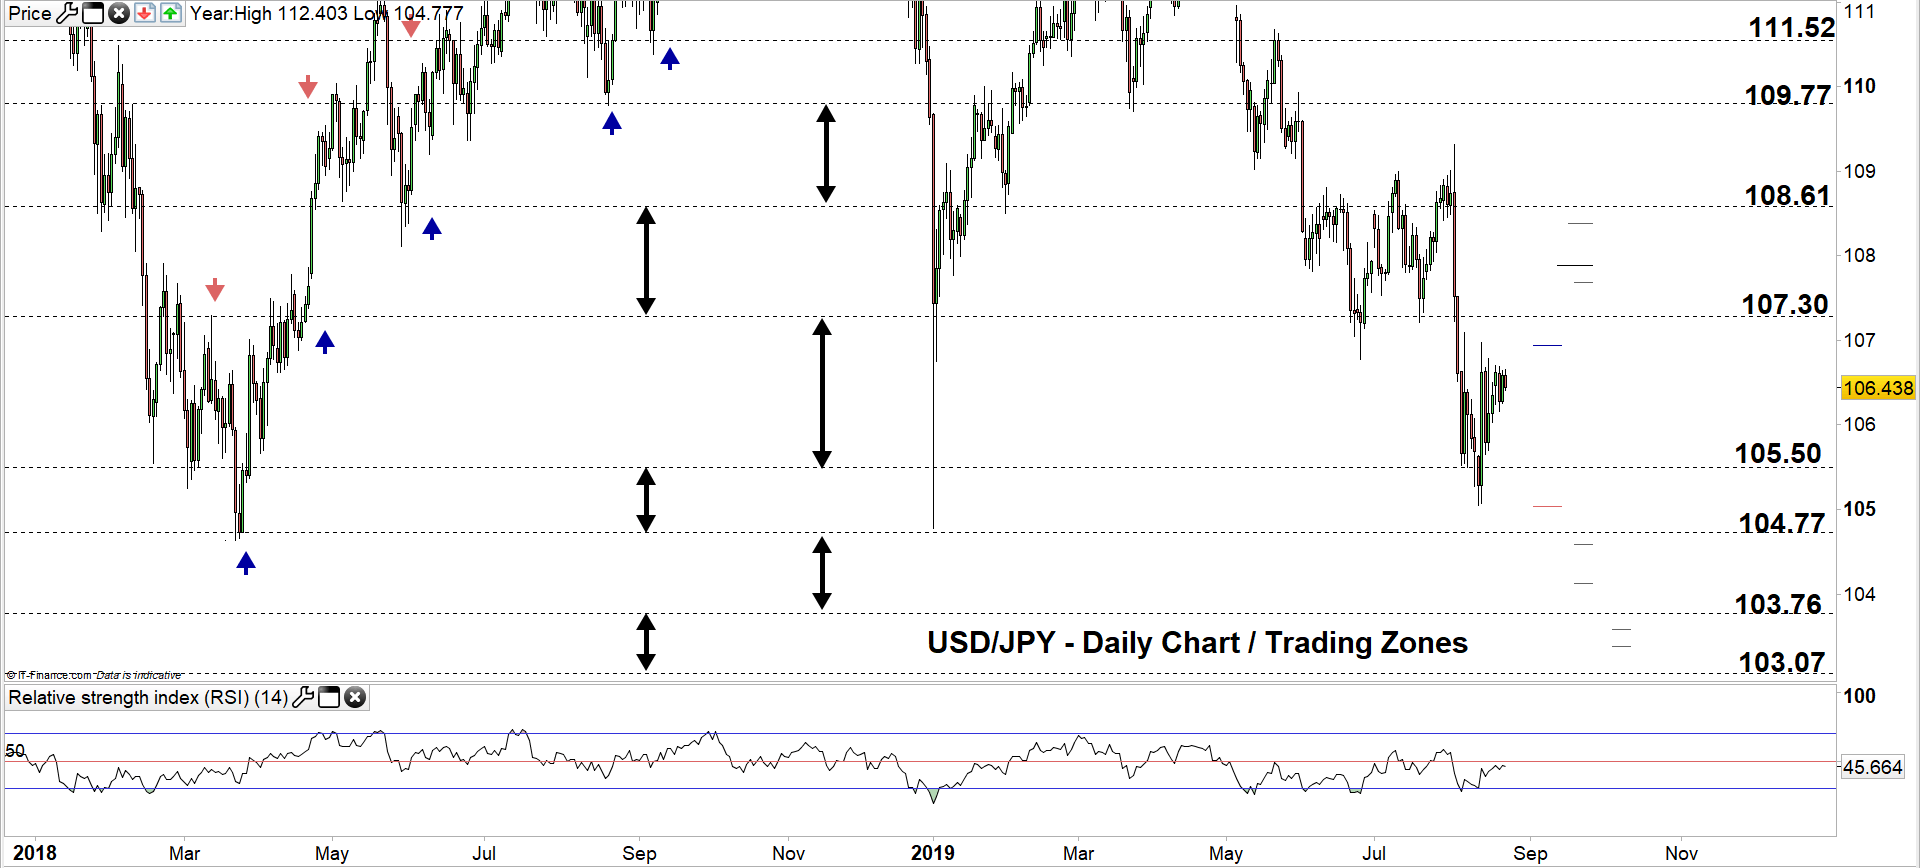
USD/JPY DAILY PRICE CHART (DEC 15, 2018 – AUG 22, 2019) Zoomed out
USD/JPY DAILY PRICE CHART (MAY 31 – AUG 22, 2019) Zoomed in
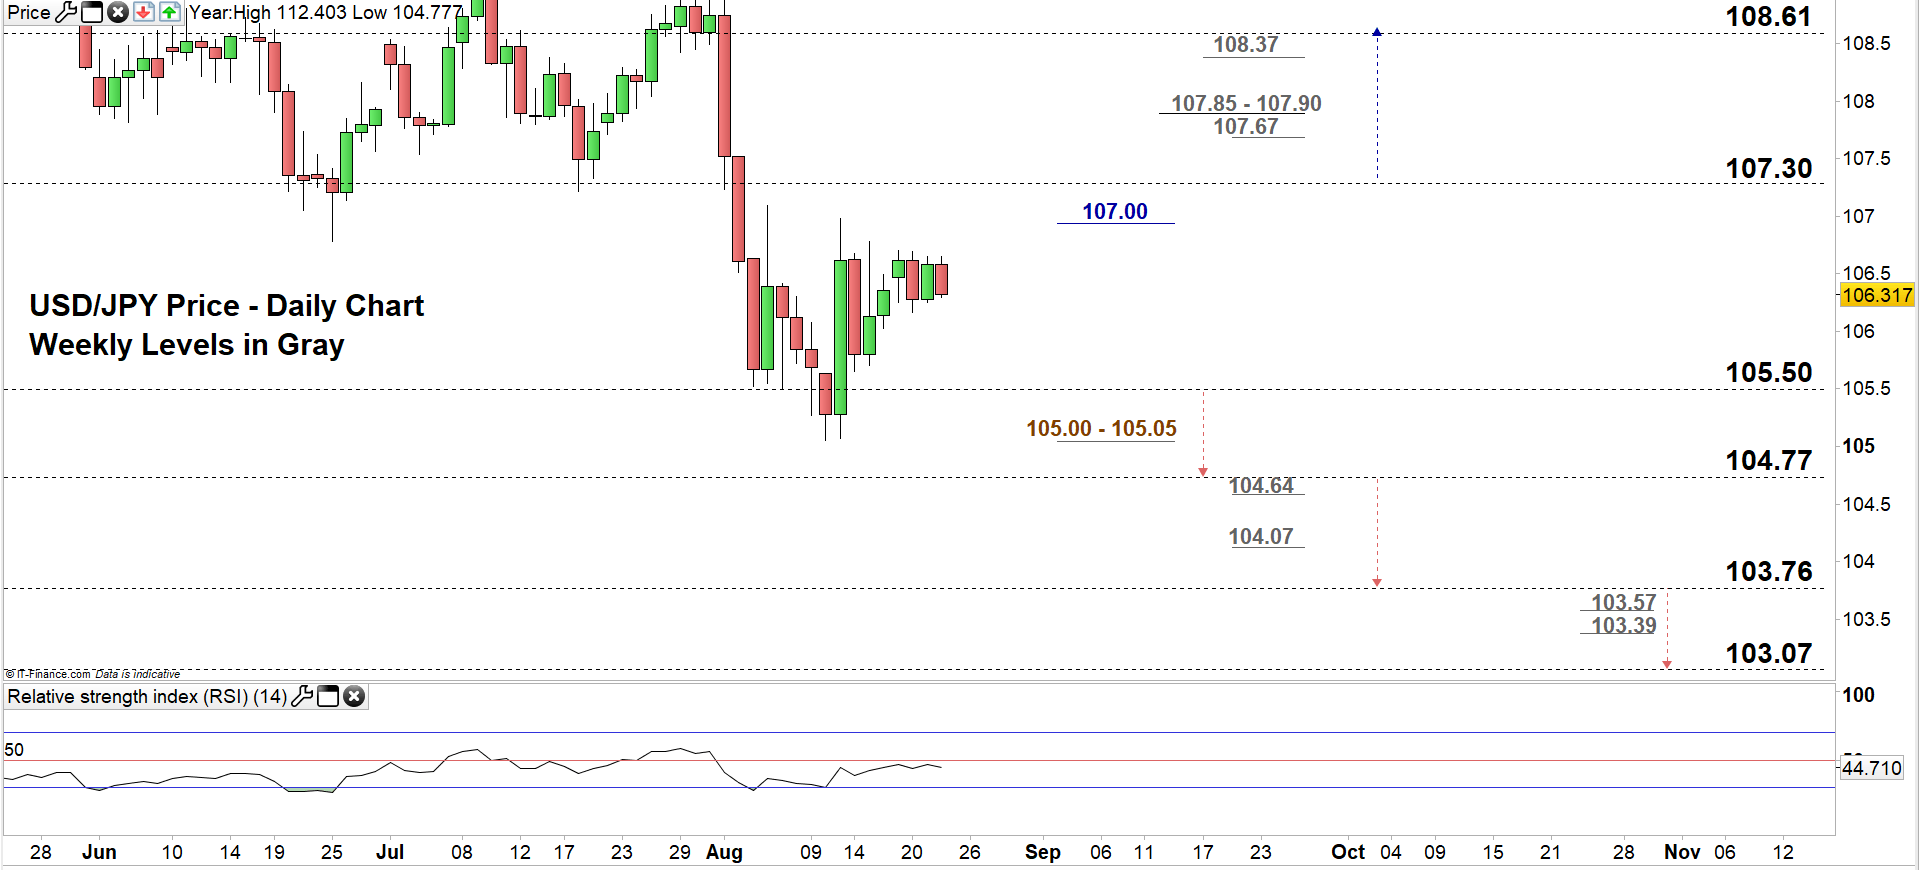
Looking at the daily chart, we notice at the start of this week USD/JPY opened with an upward gap, since then the pair has been moving ineffectively reflecting the market’s indecision. Currently, the price is moving in the trading zone 105.50 – 107.30 and eyes a test of the high end of the zone, contingent on overtaking the 107.00 handle.
Thus, a close above the high end could push USDJPY towards 108.61. Although, the weekly resistance levels and area marked on the chart (zoomed in) should be kept in focus.
On the other hand, a close below the low end may send the USDJPY towards 104.77 however, the weekly support area underlined on the chart needs to be watched closely. Further close below 104.77 could press the price even lower towards 103.07. The weekly support levels should be considered.
Written By: Mahmoud Alkudsi
Please feel free to contact me on Twitter: @Malkudsi


