
Tariffs To Hurt Consumers More Than The Tax Cuts Helped Them
Redbook Sales Growth
Redbook same-store sales growth in the week of August 17th was 4.9% which was a jump from 4.4%. This means August’s retail sales growth is tracking at a slightly lower, but still strong pace, as compared to July. This is prime shopping time for the back to school season. Each week’s data is important. The season will end in 2 weeks. When retailers report Q3 earnings, we will get a better idea of how strong the back to school shopping season was.
Tariffs Could Hurt Retail Sales
The other situation in play is the tariffs. Last year we saw businesses pre-buying in anticipation of the tariffs. Phase 3 has a lot of consumer goods. It will be interesting to see if there is pre-buying in August and early December. Redbook sales growth doesn’t suggest there is pre-buying because sales growth is slightly below its recent pace. The only way we will see proof of pre-buying is if sales growth falls off a cliff in September. There wasn’t as much lead time (from the announcement to the implementation) for the September tariffs as there is for the December 15th tariffs.
The other possible impact of the tariffs is they create uncertainty which causes consumers to pull back. So far, tariffs have done more to hurt growth than to increase prices as inflation is below the Fed’s target. On specific goods, prices increased, but on an overall basis, prices aren’t up because non-tariffed goods saw their prices fall.
The chart below breaks down the major impacts on consumers that will occur in September and December if nothing is done to delay or cancel the tariffs. Phase 3 is when the tariffs start to have a major impact on the economy. That’s even though the tariff rate is 10%, while the rate in the first 2 phases is 25%. As you can see, phase 1 and 2 combined hurt households by $628 per year according to the average estimate. The Fed estimates the negative impact is $831. That’s smaller than phase 3.
(Click on image to enlarge)
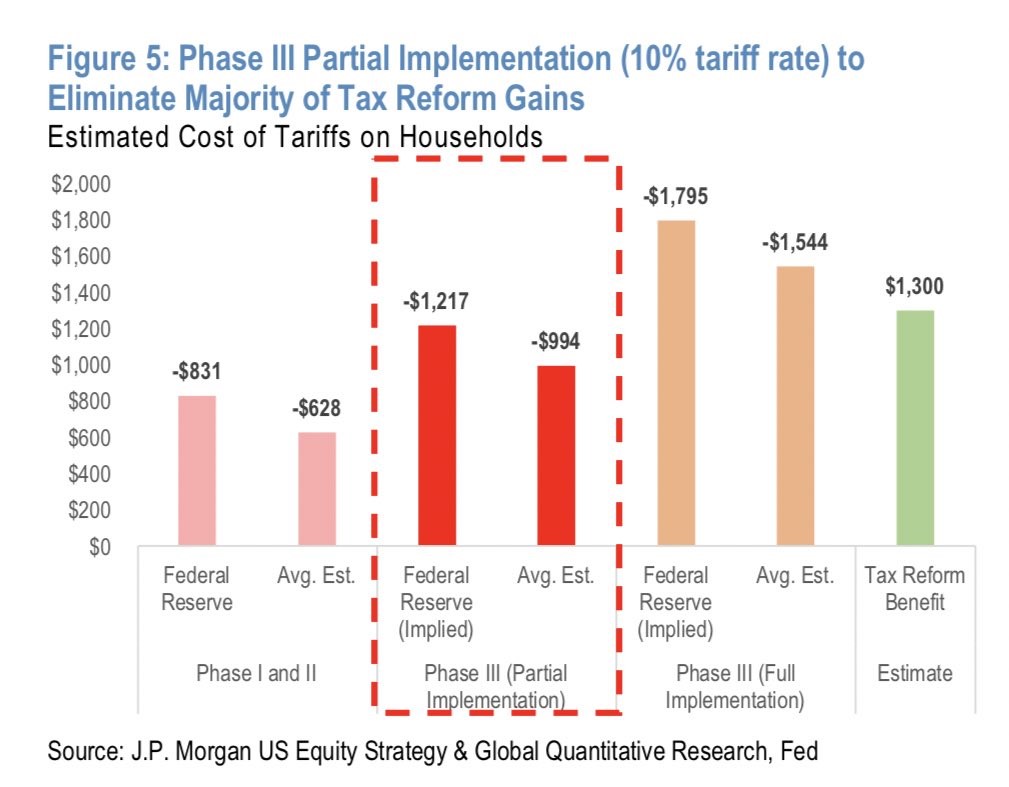
The partial implementation of phase 3 will hurt households by either $994 or $1,217 depending on whether you follow the average estimate or the Fed’s projection. Because there are only 10 days between now and the start of September and stocks aren’t crashing, it seems likely Trump will go through with these harmful taxes. The top 5 largest S&P 500 firms hurt by these tariffs in September are the following: Apple, Boeing, Nike, Caterpillar, and Intuitive Surgical. The median month to date performance of the 39 S&P 500 firms affected by the first part of phase 3 tariffs is -11%. They are down 18% year to date.
I don’t think the December 15th tariffs will be implemented because the consumer will be hurt severely. The odds of the tariffs being implemented depend partially on how severely the September tariffs affect consumption. If you are a bull, it could make sense to root for weak retail sales growth in September and October so the next part of phase 3 is delayed or canceled.
The consumer is the main reason why the economy is avoiding a recession. If these tariffs go through, economic growth could be negative in Q1 2020. It’s very tough to bet on the bull case for the economy because it relies on the tariffs being rescinded. I read a comment that stated this isn’t a real trade war because the tariffs have been delayed. In a real all-out trade war, we would see tariffs all at once, causing maximum damage to both the Chinese and American economies. This has been a slow process lasting a couple of years. The goal has always been negotiation rather than destroying either economy.
Part 2 of phase 3 will hurt households by $550 based on the average estimate. Combined the negative impact of all tariffs will be $1,544 which is larger than the positive effect of the tax cuts which is $1,300. The Fed’s implied estimate is $-1,795. This huge impact explains why I don’t think it will go through. The top 5 S&P 500 firms by market cap hurt by these tariffs are the following: Apple, Cisco, Nike, Illinois Tool Works, and Estee Lauder. Of the 35 S&P 500 affected by the December tariffs, their month to date return is -9%. Their year to date loss is 8%. The combination of the strong dollar and these tariffs will have a terrible impact on S&P 500 earnings in the next couple quarters.
August MBA Applications
The August 16th MBA Applications report showed the composite index was down 0.9% weekly after rising 21.7% because of the jump in refinancing activity. The refinance index was up 37% last week and up 0.4% this week. The purchase index was down 4% weekly after rising 2%. Partially because of a tougher comp, yearly growth fell from 12% to just 5%. This doesn’t change my outlook on the housing market.
Improved Existing Home Sales
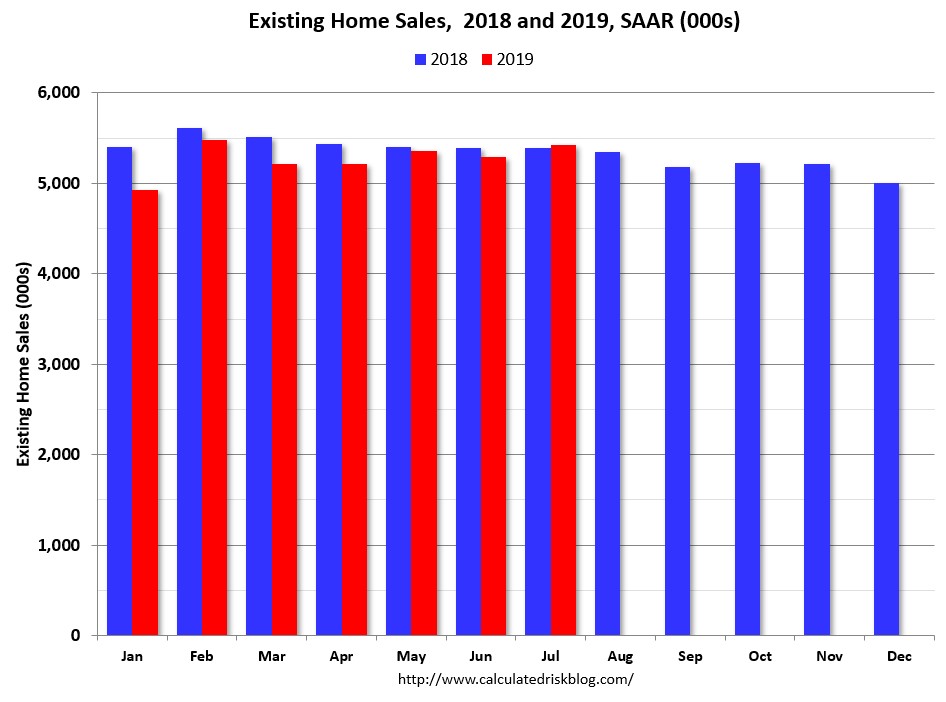
Finally, we got a very solid hard data housing report because of the decline in interest rates. The July existing home sales report showed there were 5.42 million sales which beat estimates for 5.385 million. That was up from 5.29 million in June which was revised higher by 20,000. Monthly sales growth was 2.5% and yearly growth was 0.6%. Year to date sales growth is -2.9%. As you can see in the chart below, this was the best reading since February.
(Click on image to enlarge)
Single home sales were 4.84 million which was a 1% increase from last year. Condo sales were steady at 580,000. Supply fell 1.6% monthly to 1.89 million. The National Association of Realtors cited limited choices as a top concern from buyers. Median home prices were up 4.3% yearly to $280,800. Just like the Housing Market index showed, the West was the strongest region as sales growth was in the high single digits. The South and the Midwest were in the low single digits. The Northeast, which had the worst Housing Market index, had a low single-digit decline.
Disclosure: None.


