
Crude Oil’s Descending Triangle
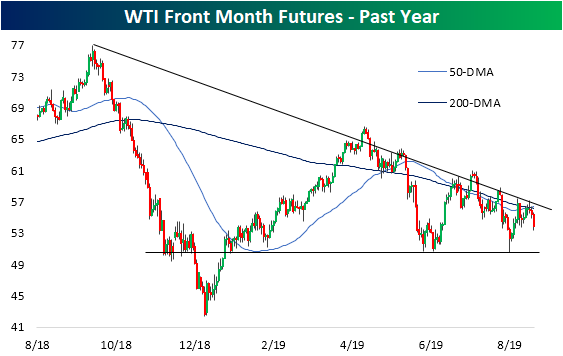
Earlier this week, crude oil was trading well over 2% higher than last Friday’s close. Over the past few sessions, though, oil has given up all of those gains. The catalyst for today’s declines are the Chinese retaliatory tariffs on US crude which are expected to dampen demand. This week’s negative reversal comes as the commodity ran into multiple points of resistance. For starters, the rally began to stall out mid-week when it met the converging 200 and 50-day moving averages. This also coincided with a downtrend that traces itself all the way back to the highs from late last year. In fact, crude is down around 30% from these previous highs.
Overall, the technical picture for crude oil is not in a great place as the chart is forming a descending triangle pattern. Despite the big gains at the beginning of 2019, over the past few months, crude has been making consistent lower highs and lower lows. Given this most recent failure to retake the moving averages and break out of the downtrend, the next major support level to watch is around $50 which is a level that has held up at multiple times in the past few months. This support also draws back to late last year prior to the collapse in December.
(Click on image to enlarge)
Disclaimer: Read our full disclaimer here.


