


AUSTRALIAN DOLLAR WEEKLY TECHNICAL OUTLOOK – AUDUSD, AUDJPY, EURAUD:
- The Australian Dollar keeps climbing higher, but the recent ascent may be running out of steam
- AUDUSD and AUDJPY face serious technical obstacles for trend continuation while EURAUD could be gearing up for a reversal
- Looking to learn more about the currency market? Check out our free educational guide on Forex Trading
Australian Dollar price action has notched an impressive rally so far this month. In fact, the near-vertical ascent in AUDUSD over the last 10 trading days marks the strongest stretch of gains over the same lookback period since January. Yet, technical confluence around the 0.6900 handle appears to be presenting itself as an obstacle for trend continuation in the Australian Dollar as upside turns sluggish. At the same time, the RSI is running hot as the Australian Dollar approaches a reading of 70 and “oversold” territory while the MACD could suggest upward momentum is fading.
AUDUSD PRICE CHART: DAILY TIME FRAME (APRIL 11, 2019 TO SEPTEMBER 13, 2019)
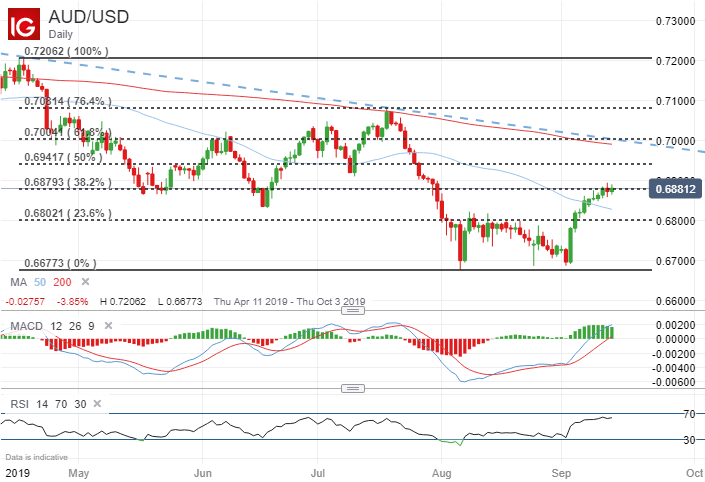
If AUDUSD price action can continue higher into next week, however, the July swing low around 0.6915 might be targeted as the next upside objective before resistance posed by the midpoint retracement level of the currency pair’s trading range since April comes into consideration. Looking to the downside, spot AUDUSD has potential to find support from its 50-day simple moving average and June swing low around 0.6835. Major resistance-turned-support at the 0.6800 handle will likely be eyed subsequently by AUDUSD bears if the aforementioned technical levels fail to keep the Australian Dollar afloat.
AUDJPY PRICE CHART: DAILY TIME FRAME (APRIL 12, 2019 TO SEPTEMBER 13, 2019)

Australian Dollar gains have been particularly striking when looking at AUDJPY. The infamous sentiment-linked currency pair has soared as US-China trade tensions thaw which has boosted risk appetite and helped propel spot AUDJPY to its highest level since August 1. The sharp rebound higher in the Australian Dollar has moved with such conviction it was enough to smash through bearish trend resistance extended from the swing highs in April and July.
Spot AUDJPY now treads comfortably above the 74.000 handle – an area of technical confluence underscored by the June swing low and 38.2% Fibonacci retracement level of its year-to-date trading range – which Aussie bulls will likely look to hold as price action unfolds. Below this area, the 50-DMA and recently formed uptrend line also have potential to provide support.
EURAUD PRICE CHART: DAILY TIME FRAME (APRIL 12, 2019 TO SEPTEMBER 13, 2019)
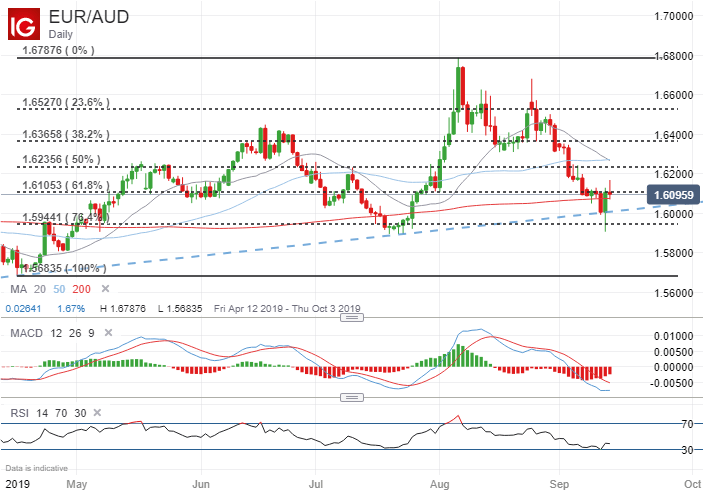
Last but not least, the technical backdrop on spot EURAUD is quite intriguing. The bullish wick printed in the wake of the September ECB meeting is a bit discouraging for those anticipating further downside in spot EURAUD. Also, the RSI bouncing off “oversold territory” and converging moving averages suggested by the MACD indicator both speak to the potential that a reversal higher may be in the making. If EURAUD can firm its footing above the 1.6100 mark and 61.8% Fibonacci retracement level of its 2019 trading range, spot prices may be able to march higher and test the 1.6200 price level. This area of resistance is underscored by the 50% retracement of its year-to-date range in addition to its 20-DMA and 50-DMA.
-- Written by Rich Dvorak, Junior Analyst for DailyFX.com
Connect with @RichDvorakFX on Twitter for real-time market insight


