Stay above the levels keeps the technical tilt to the upside
The NZDUSD has extended to new week highs today in what has been an up and down trading week for the pair.
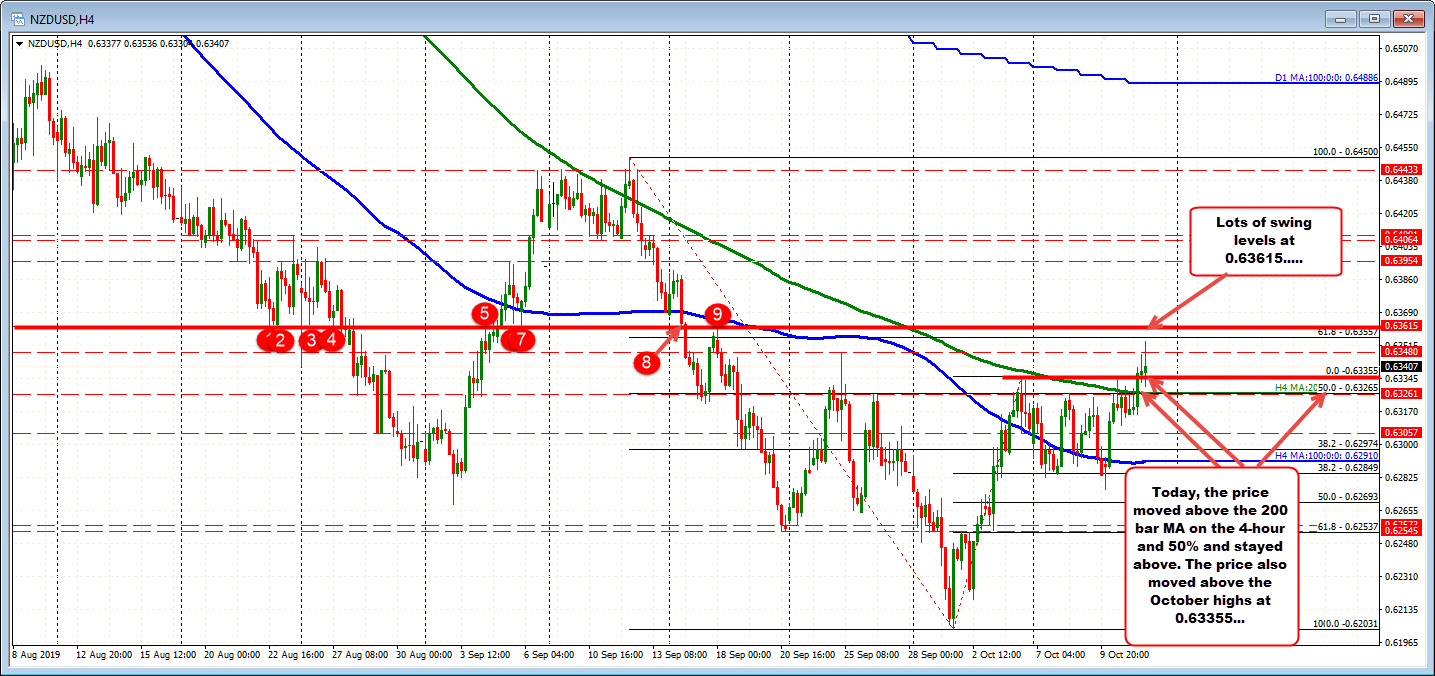
The high price coming into today was near the high price from last week at the 0.63355 level. After stalling against that level in trading yesterday, the price fell back below its 200 bar moving average on the 4 hour chart (green line currently at 0.63265).
Today, however, the price has been able to extend above the 200 bar moving average and also the 50% retracement of the move down from the September high at the same level. The price has also traded mostly above the highs from last week at 0.6335.
As a result, the tilt and bias is a little more to the upside.
Is racing to the upside? Not really but as long as the 50% retracement and 200 bar moving average can hold support, that's good enough for me for now.
Over time getting above the 0.6348 level (high price from September 25) and the 61.8% retracement at 0.63557, will be needed to shift the bias even more to the upside.
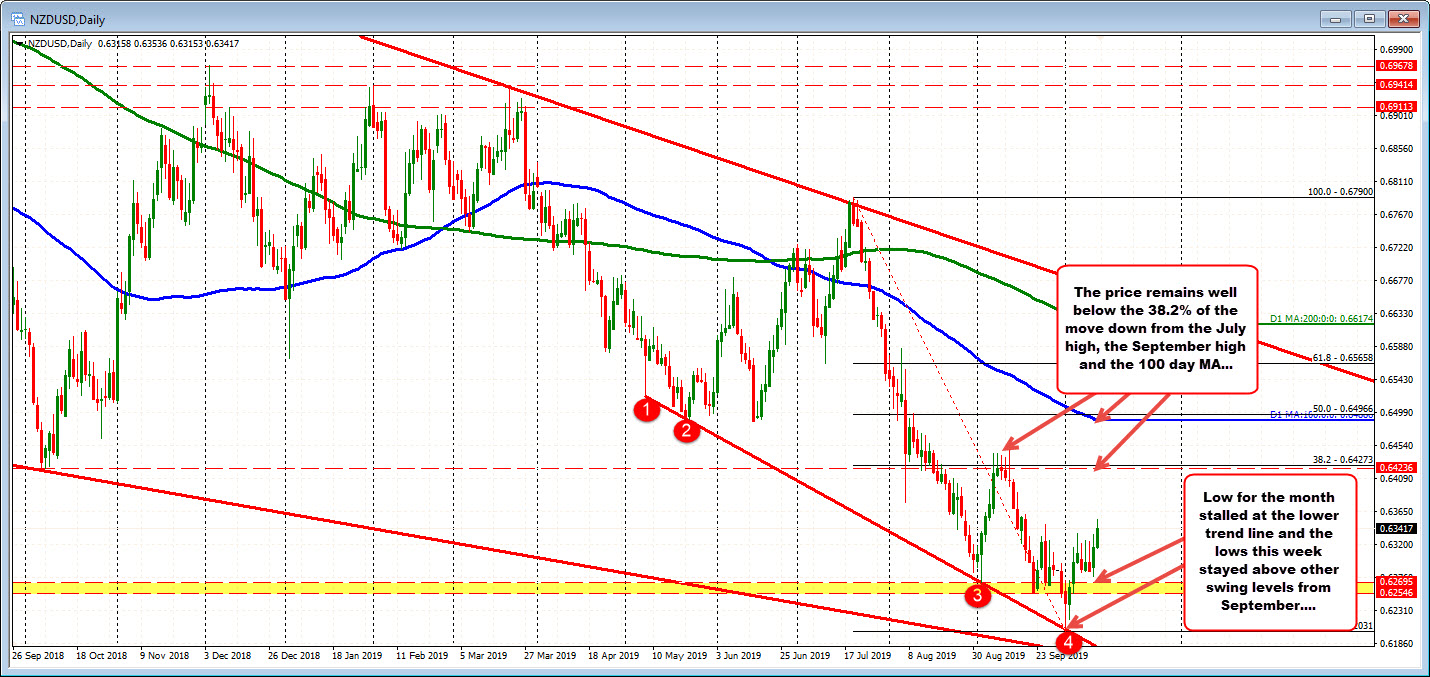
Taking a broader look from the daily chart, the technical picture is cautiously bullish, but there is a lot of work to do).
Helping the bullish cause is:
- The low for the month stalled against a lower trendline (see red numbered circles in the chart below).
- The price this week stay above September swing lows at 0.6269 and 0.6254.
Needless to say, the price is still him him him him him him him him him him him him him him him near the lower levels and well below the 38.2% at 0.6427), the September highs and the 100 day MA (at 0.6491).