- GBP/JPY steps back from the late-May top, downward sloping resistance line since mid-March.
- Sellers await downside break of 200-day SMA amid overbought RSI conditions.
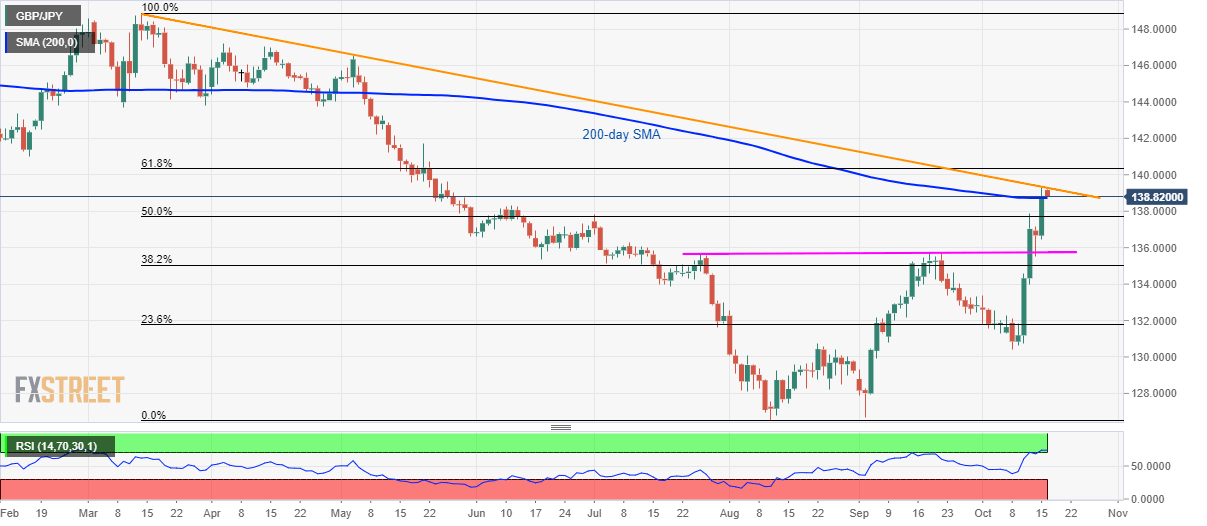
In addition to the failure to rise beyond multi-month old falling trend line, overbought conditions of 14-bar Relative Strength Index (RSI) also trigger the GBP/JPY pair’s pullback to 138.87 during Wednesday’s Asian session.
Sellers await the downside break of the 200-day Simple Moving Average (SMA) level of 138.72 to enter while targeting July month high of 137.80.
However, pair’s declines below 137.80 might not refrain from challenging 135.65/75 area including tops marked in late-July and September.
On the upside, pair’s sustained trading beyond a downward sloping trend line since mid-March, at 139.30, could escalate the run-up to 140.00 and 61.8% Fibonacci retracement of the downside since March month, at 140.35.
During the pair’s further rise above 140.35, late-May tops nearing 141.80 will be on the bulls’ radar.
GBP/JPY daily chart
Trend: pullback expected
Information on these pages contains forward-looking statements that involve risks and uncertainties. Markets and instruments profiled on this page are for informational purposes only and should not in any way come across as a recommendation to buy or sell in these assets. You should do your own thorough research before making any investment decisions. FXStreet does not in any way guarantee that this information is free from mistakes, errors, or material misstatements. It also does not guarantee that this information is of a timely nature. Investing in Open Markets involves a great deal of risk, including the loss of all or a portion of your investment, as well as emotional distress. All risks, losses and costs associated with investing, including total loss of principal, are your responsibility. The views and opinions expressed in this article are those of the authors and do not necessarily reflect the official policy or position of FXStreet nor its advertisers. The author will not be held responsible for information that is found at the end of links posted on this page.
If not otherwise explicitly mentioned in the body of the article, at the time of writing, the author has no position in any stock mentioned in this article and no business relationship with any company mentioned. The author has not received compensation for writing this article, other than from FXStreet.
FXStreet and the author do not provide personalized recommendations. The author makes no representations as to the accuracy, completeness, or suitability of this information. FXStreet and the author will not be liable for any errors, omissions or any losses, injuries or damages arising from this information and its display or use. Errors and omissions excepted.
The author and FXStreet are not registered investment advisors and nothing in this article is intended to be investment advice.
Recommended content
Editors’ Picks
AUD/USD jumps above 0.6500 after hot Australian CPI data

AUD/USD extended gains and recaptured 0.6500 in Asian trading, following the release of hotter-than-expected Australian inflation data. The Australian CPI rose 1% in QoQ in Q1 against 0.8% forecast, providing extra legs to the Australian Dollar upside.
USD/JPY hangs near 34-year high at 154.88 as intervention risks loom

USD/JPY is sitting at a multi-decade high of 154.88 reached on Tuesday. Traders refrain from placing fresh bets on the pair as Japan's FX intervention risks loom. Broad US Dollar weakness also caps the upside in the major. US Durable Goods data are next on tap.
Gold price cautious despite weaker US Dollar and falling US yields

Gold retreats modestly after failing to sustain gains despite fall in US Treasury yields, weaker US Dollar. XAU/USD struggles to capitalize following release of weaker-than-expected S&P Global PMIs, fueling speculation about potential Fed rate cuts.
Crypto community reacts as BRICS considers launching stablecoin for international trade settlement

BRICS is intensifying efforts to reduce its reliance on the US dollar after plans for its stablecoin effort surfaced online on Tuesday. Most people expect the stablecoin to be backed by gold, considering BRICS nations have been accumulating large holdings of the commodity.
US versus the Eurozone: Inflation divergence causes monetary desynchronization

Historically there is a very close correlation between changes in US Treasury yields and German Bund yields. This is relevant at the current juncture, considering that the recent hawkish twist in the tone of the Fed might continue to push US long-term interest rates higher and put upward pressure on bond yields in the Eurozone.