Join Our Telegram channel to stay up to date on breaking news coverage
LTC Price Prediction – June 1
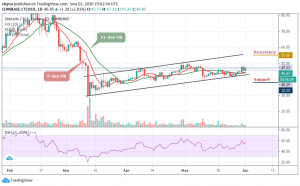
The Litecoin price is currently changing hands at $46.85. The RSI (14) indicator moves around 57-level.
LTC/USD Market
Key Levels:
Resistance levels: $55, $57, $59
Support levels: $38, $36, $34

As of now, LTC/USD is currently trading at around $46. Once it manages to surpass the current resistance of $47.85, the next target is at $48 where it touched a few days ago. More so, a breach from here may send the price straight to around $52 as the last 48-hours surge is supported at $44 support level. Therefore, if this level fails to hold strong, the price could slip back below the 9-day and 21-day moving averages at $43.
However, looking at the current market sentiment, the bulls are now gaining back control of the market. Moreover, if the bulls can put more effort and push the market towards the upper boundary of the channel, then the market price may likely hit the resistance levels of $55, $57, and $59 respectively. More so, any movement above these key resistance levels should, therefore, encourage further buying.
Nevertheless, a break below the lower boundary of the channel may provoke an even deeper decline towards the $38, $36, and $34 support levels. Meanwhile, looking at the technical indicator RSI (14), Litecoin may exhibit the tendencies to follow an upward trend as the coin moves towards the 60-level which may cause the market to remain stable at the average.
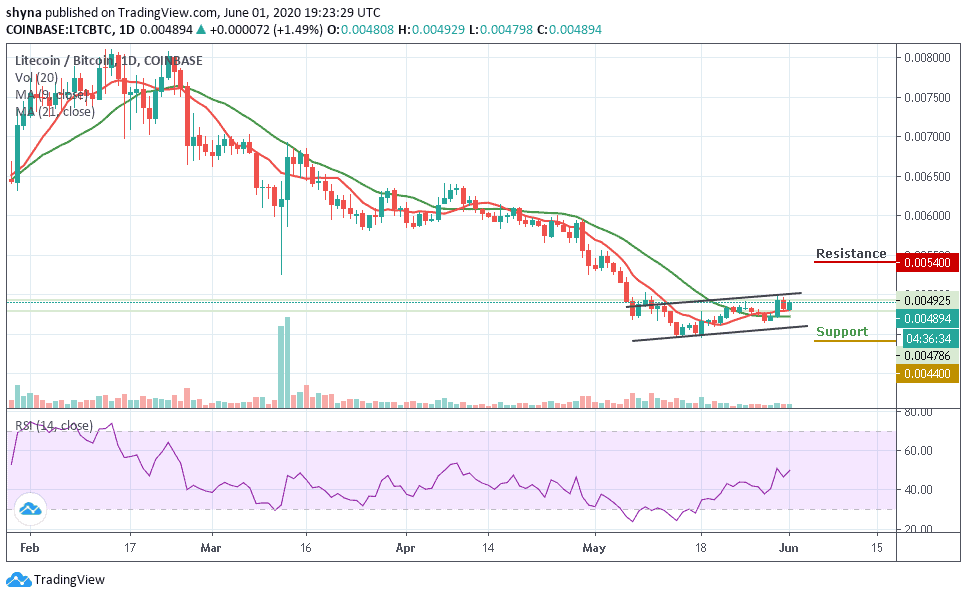
Comparing with Bitcoin, the LTC price is making an attempt to cross the upper boundary of the channel in other to reach the resistance at 5200 SAT. Unless this resistance is effectively exceeded and the price ends up closing above it, there might not be any reason to expect the long-term bullish reversal.
In other words, trading below the moving averages could refresh lows under 4600 SAT and a possible bearish continuation may likely meet the major support at 4500 SAT before falling to 4400 SAT and below while the buyers may push the coin to the potential resistance at 5400 SAT and above. More so, the RSI (14) moves toward the north to give more bullish signals.
Please note: Insidebitcoins.com is not a financial advisor. Do your research before investing your funds in any financial asset or presented product or event. We are not responsible for your investing results.
Join Our Telegram channel to stay up to date on breaking news coverage