Join Our Telegram channel to stay up to date on breaking news coverage
XRP Price Prediction – March 28
XRP/USD bears retained control as the price fell further from $0.175 to $0.168 in the early hours of today.
XRP/USD Market
Key Levels:
Resistance levels: $0.20, $0.22, $0.24
Support levels: $0.14, $0.12, $0.10
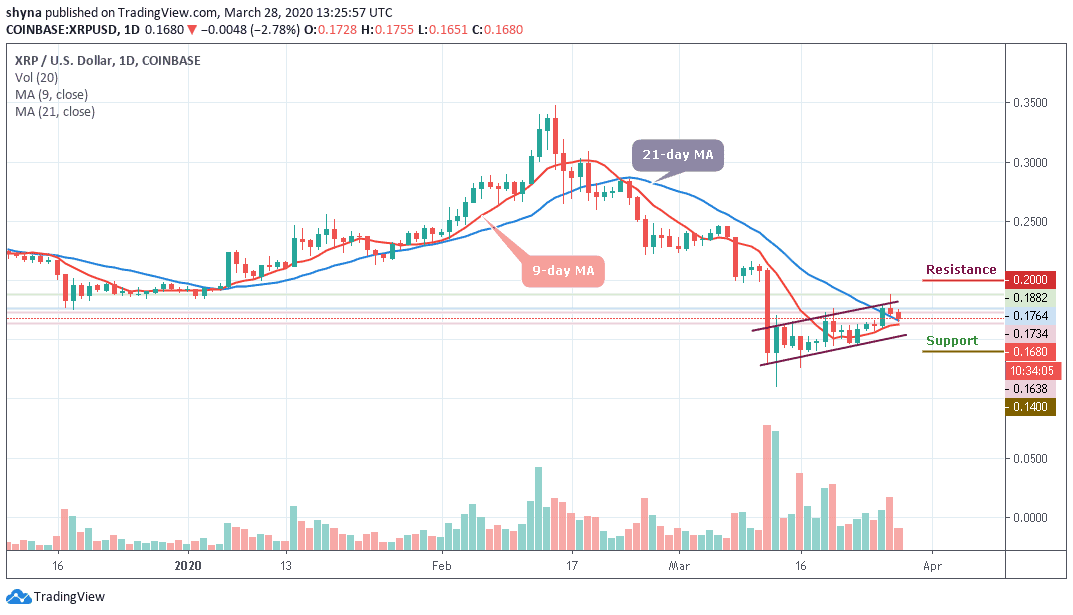
Today, XRP/USD dived below $0.175 amid major sell-off. The coin needs to stay above $0.160 to maintain its bullish movement. Yesterday, Ripple’s XRP touched $0.188 and resumed the sell-off amid the worsened sentiments on cryptocurrency markets. At the time of writing, XRP/USD is changing hands at $0.168, down over 2.78% since the beginning of the day.
However, a sustainable move below $0.170 worsened the short-term technical picture and brought more sellers to the market. The initial support is created by a 21-day MA on approach to $0.166. Once it is out of the way, the downside may likely gain traction with the next focus on psychological $0.160. Meanwhile, this area should slow down the downside momentum and allow for an upside correction. If not, moving further below the 9-day MA may allow the price to touch the critical support levels at $0.14, $0.12 and $0.10 respectively.
On the upside, the buyers may need to make a sustainable move above $0.170 as soon as possible to negate an immediate bearish scenario and improve the technical picture. Nevertheless, for the upside to gain traction, the coin needs to regain ground above $0.180, while $0.20, $0.22 and $0.24 resistance levels are the ultimate aims for the bulls. At the moment, the technical indicator RSI (14) is moving below 45-level, which indicates more bearish signals.
When compared with Bitcoin, the Ripple (XRP) moves within the channel as the price trades above the 9-day and 21-day moving averages. Now, the bulls appear to be stepping back into the market, and we may expect a bullish movement to 2900 SAT and 3000 SAT resistance levels. At the time of writing, XRP/BTC is changing hands at 2724 SAT.
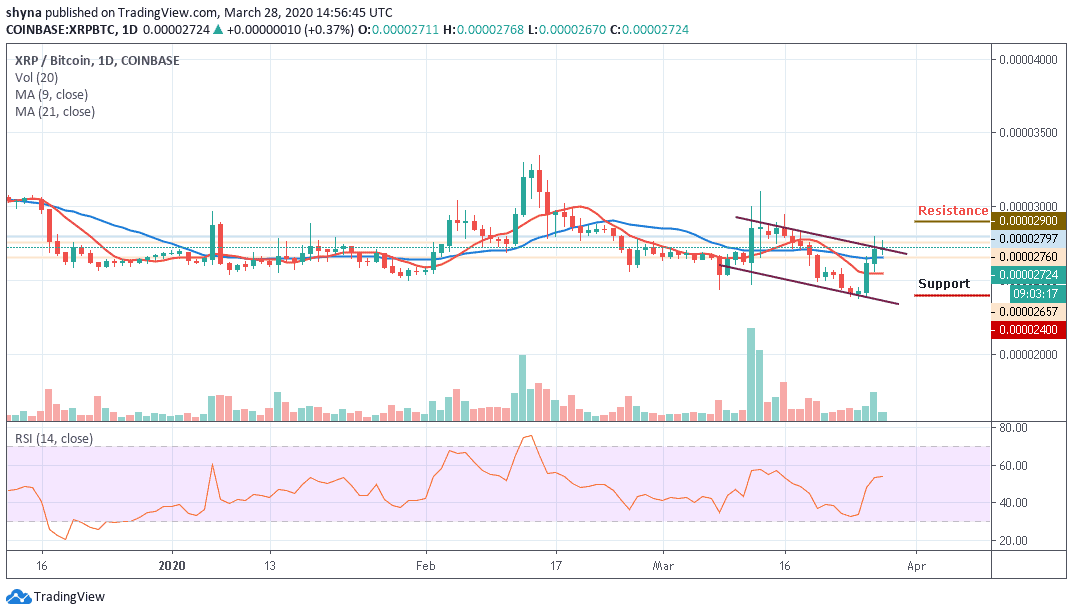
Nevertheless, if the sellers push the price below the moving averages, the next level of support is located at 2600 SAT and more supports are found at 2400 SAT and 2200 SAT. Meanwhile, the technical indicator RSI (14) faces the south, hoping to bring more bullish signals.
Please note: Insidebitcoins.com is not a financial advisor. Do your research before investing your funds in any financial asset or presented product or event. We are not responsible for your investing results.
Join Our Telegram channel to stay up to date on breaking news coverage