Join Our Telegram channel to stay up to date on breaking news coverage
BCH Price Analysis – May 27
BCH/USD seems to be caught between the bull and the bear, while the price of the cryptocurrency fluctuates in sideways.
BCH/USD Market
Key Levels:
Resistance levels: $280, $300, $320
Support levels: $180, $160, $140
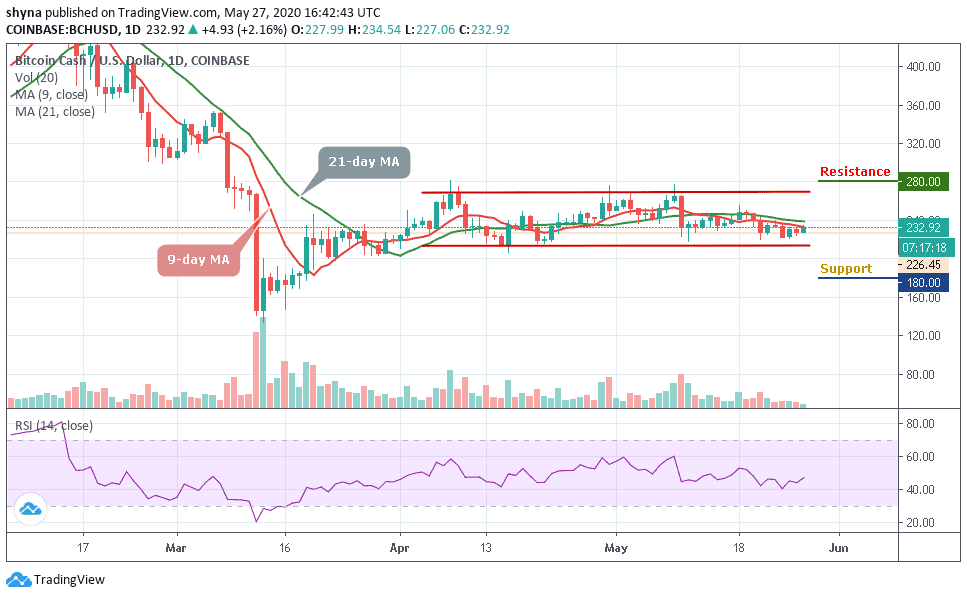
BCH/USD has been showing an uneven movement with several falls and rises, which makes not be able to maintain a consistent bullish run. However, the coin may continue to show some signs of a downward movement if the green-line of 21-day MA remains above the red-line of 9-day MA. Meanwhile, for the past few days, the market has been forming a pattern where the day begins with either having an uptrend or downtrend, but towards the end, it reverses.
However, BCH/USD price has continued to consolidate itself in a flag formation, waiting for a cross above the moving average. More so, the daily breakdown reveals that BCH/USD begins today’s trading at $226.45 after which it touches the high of $235 now hovering at $232. If the support gets weak, a price break-down may occur as the bears may find new weekly lows at $180, $160, and $140 support levels.
Nevertheless, more bullish trends may likely push the market above the moving averages with a possible break out of the channel to hit the resistance levels of $280, $300, and $320 resistance levels, establishing a new weekly high for the market. At the moment, the RSI (14) indicator is now moving above 45-level.
Comparing with Bitcoin, the recent sideways movement is due to the price stability within the market. More so, the market is preparing to change the trend and a short-term bearish breakout is most likely to play out because the technical indicator stochastic RSI moves within the overbought zone and this could find the nearest support levels at 2150 SAT and below.
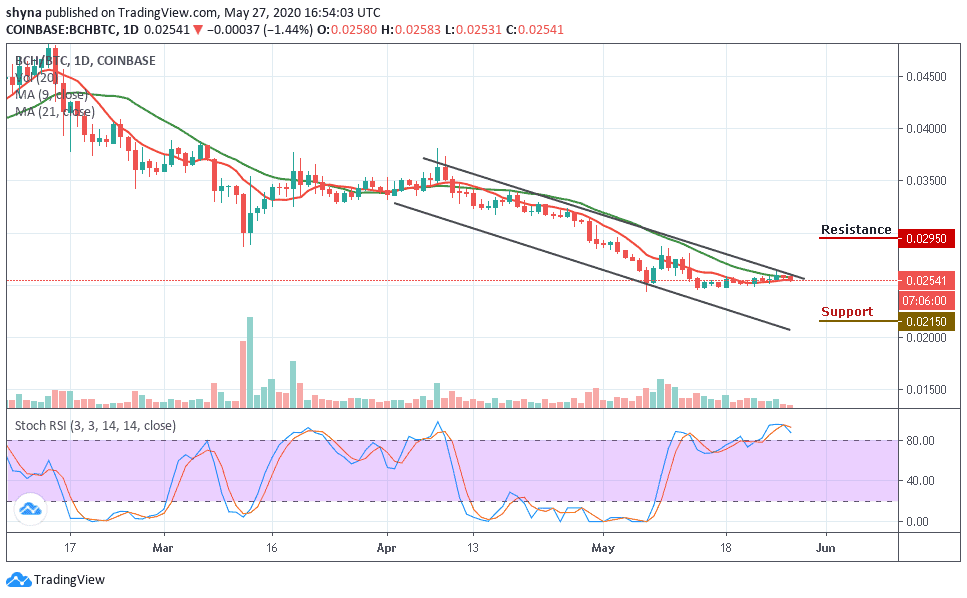
Furthermore, the only condition for a bullish movement is if the 2500 SAT level can continue to provide support for the market, then the price may likely go above the channel to hit the resistance level of 2950 SAT and above. Meanwhile, the pair continues to remain in a sideways movement hovering within the moving averages.
Please note: Insidebitcoins.com is not a financial advisor. Do your research before investing your funds in any financial asset or presented product or event. We are not responsible for your investing results.
Join Our Telegram channel to stay up to date on breaking news coverage