Join Our Telegram channel to stay up to date on breaking news coverage
Litecoin (LTC) Price Prediction – May 30
Litecoin adds 3.89% in a day, and at the time of writing, it is trading around $46.21.
LTC/USD Market
Key Levels:
Resistance levels: $50, $55, $60
Support levels: $40, $35, $30
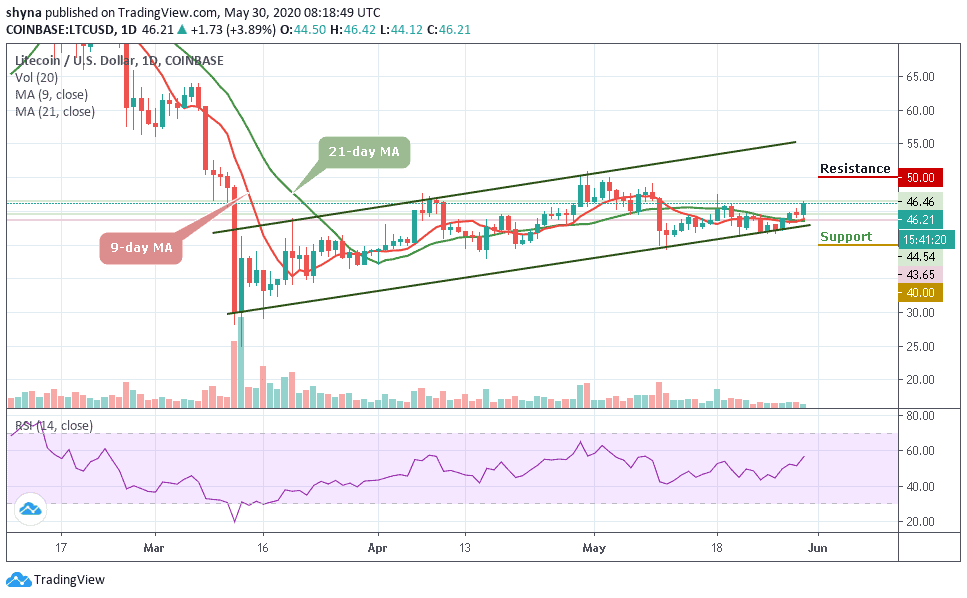
At the time writing, LTC/USD has been able to fetch a decent hike in the last 24 hours which may take the coin near $50 resistance level. The coin is already on a path of price recovery after the drop of yesterday. In addition, LTC is one of the most emerging coins of the market, and it is likely to touch $50 in the coming days as its next resistance. The long-term outlook is likely to be bullish.
Moreover, as the trading volume is coming up gradually, the coin is trading above the 9-day and 21-day moving averages within the ascending channel. On the upside, if the price moves near the upper boundary of the channel, BTC may likely continue its uptrend and could touch the resistance levels of $50, $55 and $60.
However, as the market fluctuates, there is the tendency of the bears breaking below the moving averages to touch the support of $35. Nevertheless, the technical indicator RSI (14) is about to cross the 60-level but the bears may step back into the market once the signal lines turn downward and the nearest support levels lie at $40, $35, and $30 respectively.
When compares with BTC, the bulls are making an effort to step back into the market by halting the downtrend. At the moment, the coin is trying to show some promising signs that could push the coin above the channel. From the upside, the nearest level of resistance lies at 5000 SAT and above this, higher resistance lies at 5300 SAT and above.
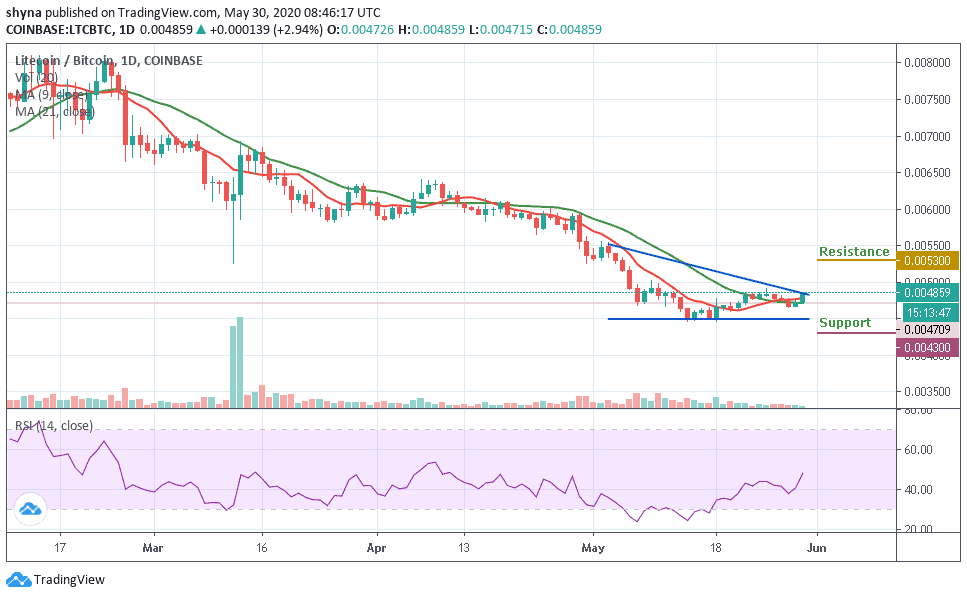
Meanwhile, from the downside; the nearest supports are 0.0046 BTC and 0.0044 BTC. If the price drops further to create a new low, lower support is located at 4300 SAT and below. Nevertheless, the technical indicator RSI (14) is making an attempt to cross above the 50-level which shows that the bulls are waking up.
Join Our Telegram channel to stay up to date on breaking news coverage