
Advertisement
Advertisement
EUR/AUD Testing 21 EMA Zone Within Massive Downtrend
By:
EUR/AUD price action was not able to break below the previous bottom. What should traders expect next?

In this article:
The EUR/AUD resumed its downtrend after completing a wave C (purple) of wave 4 (green) at the 144 ema. However, price action was not able to break below the previous bottom. What should traders expect next?
1 hour chart
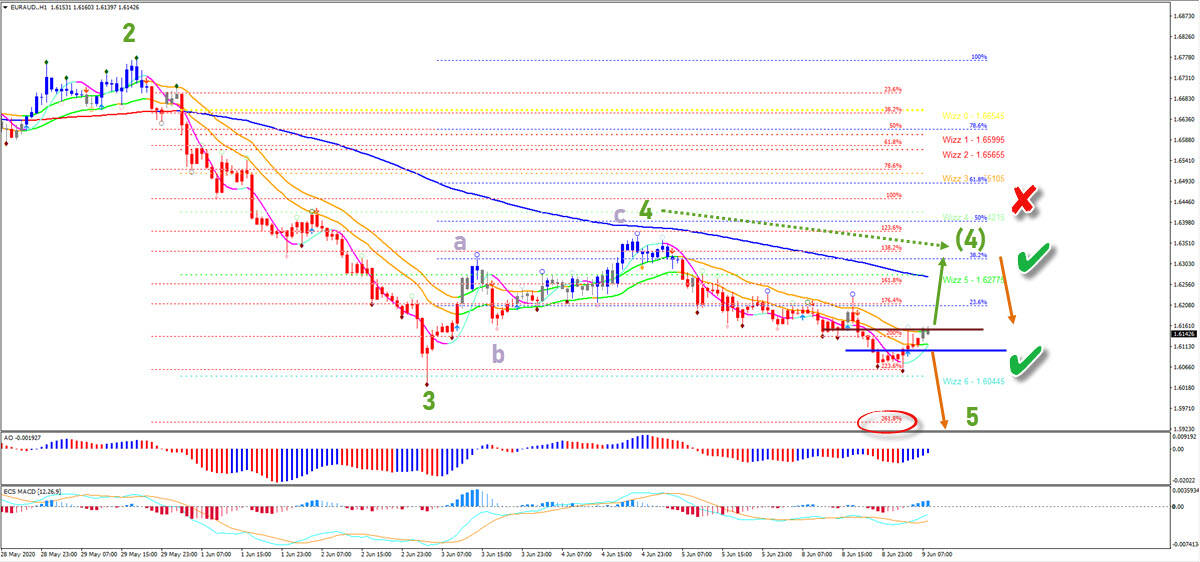
The EUR/AUD is testing again the critical 21 ema zone. A downtrend resumed after price action bounced at the 144 ema and rebroke below the 21 emas. Now price will need to break again below support (blue) to confirm the downtrend continuation. A break and close above the 21 ema zone could indicate a deeper retracement towards the 38.2% Fib. This could expand the wave 4 to a new spot (green dotted arrow).
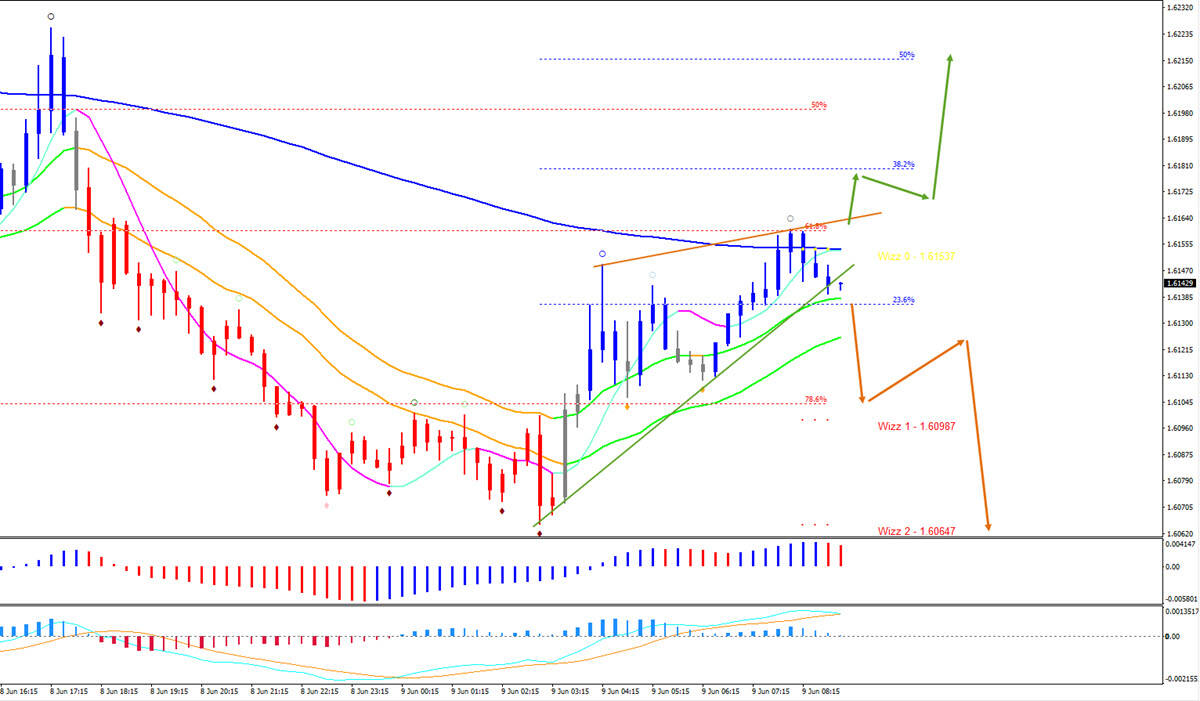
15 min chart
The EUR/AUD is testing the 144 ema on the 15 min chart. This is a key bounce or break spot. The critical aspect is to look for a breakout, pullback and continuation either up or down for a short-term price movement.
Good trading,
Chris Svorcik
The analysis has been done with the indicators and template from the SWAT method (simple wave analysis and trading). For more daily technical and wave analysis and updates, sign-up to our newsletter
For a look at all of today’s economic events, check out our economic calendar.
About the Author
Chris Svorcikcontributor
Chris Svorcik is co-founder, trader, and analyst with Elite CurrenSea (www.EliteCurrenSea.com) since 2014.
Did you find this article useful?
Latest news and analysis


Advertisement