
Intraday Analysis For EURUSD, GBPUSD, USDJPY And XAUUSD - Tuesday, June 16
EURUSD Outlook
EURUSD Yesterday’s chart analysis
EURUSD have bounced from the strong support confluence level that consists of a horizontal support line and an uptrend support line.
Bullish Pinbar was a sign that the support will hold. Between six H4 candles that have formed on the confluence level none of them did not suggest bearish scenario. The last one that have closed above $1.12806 was a clear signal that the price is moving up.
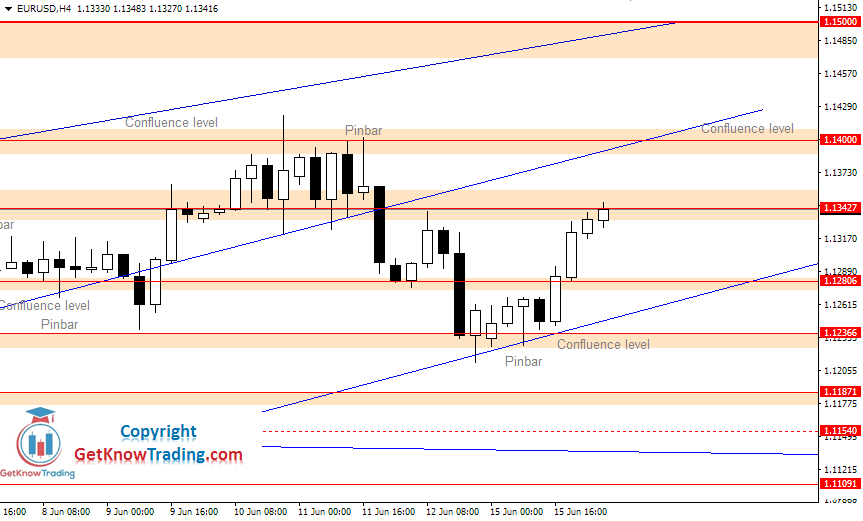
The price is now right on the resistance level that has made a barrier for the price to continue moving up. Here we will have a possible pullback to $1.12806 before attempt to break above.
We need to see close above $1.13427 to see the price trying to reach $1.14000 and eventually $1.15000. At the $1.14000 we have a resistance confluence level that could hold the price from moving higher or it could make a reversal.
GBPUSD Outlook
GBPUSD Yesterday’s chart analysis
GBPUSD closed above resistance level which suggests further move up. Large Pinbar on the support level at $1.24733 pointed for the move up and it is level where bears did not show any strength.
The price manages to close above resistance level $1.26228, which has open the road to $1.27495. That level was a strong resistance level that made price break out from the uptrend channel and revers back to $1.24733.
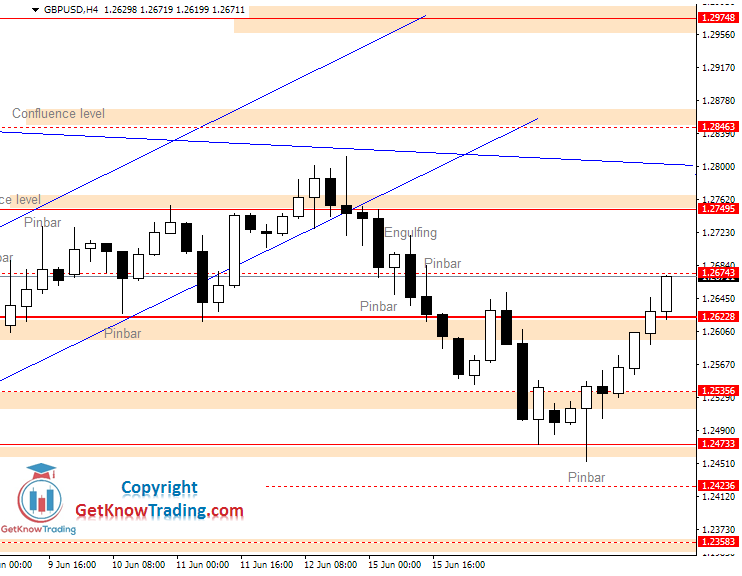
Because of the closing price above the resistance level $1.26228 I am bullish on this pair until the price close below $1.26228. This level acted as nice support in previous day’s so I am expecting the same scenario.
But, I will be cautious because the GBPUSD could get back below easily. While I am on the side of the bulls I would wait for the pullback and then enter to catch a move of 100 pips.
USDJPY Outlook
USDJPY Yesterday’s chart analysis
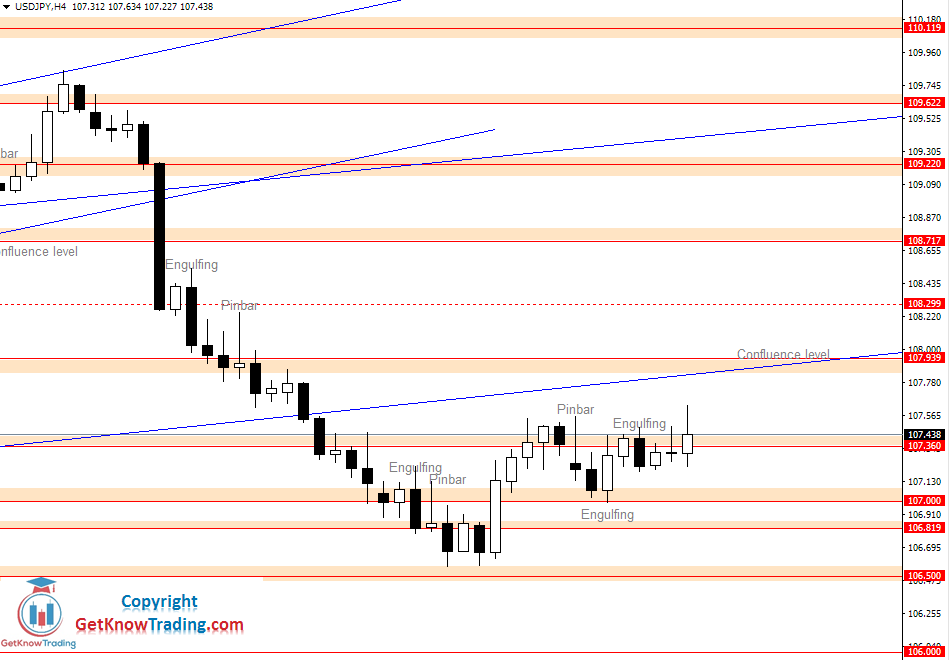
USDJPY is currently in the indecision area where several signals interfere. We have bearish Pinbar, bullish engulfing and bearish engulfing bar that makes the current situation unclear.
Last candle on the H4 time frame have made a breakout above previous highs which suggests the price is making its way up. Strong engulfing bar and now the candle that has made a breakout point towards the upper level of the previous range area.
USDJPY Chart Forecast
The upper level of the previous range is at 107.939 where we now have resistance confluence level. It is the area of strong resistance horizontal line and daily support uptrend line that now acts as a resistance.
We could see the price moving in the range area from where we should see what happens next.
XAUUSD Outlook
XAUUSD Yesterday’s chart analysis
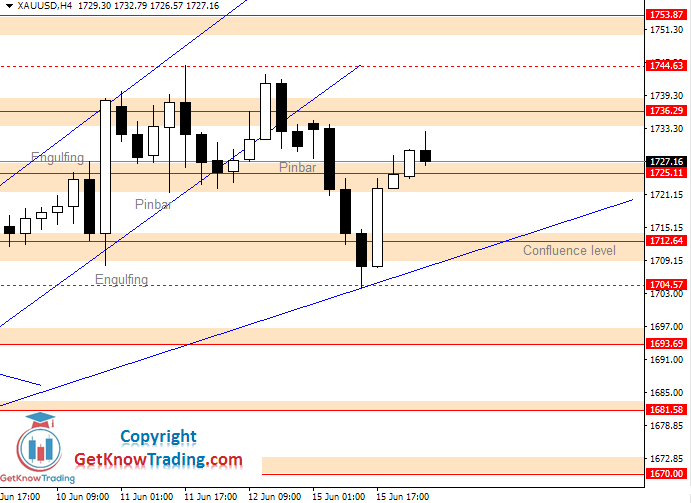
The XAUUSD yesterday have done a nice jump around the $1725.11. The price lost its ground and drop down to $1704.57 and then bounced back up, above $1725.11.
In the daily time frame we have a bullish Pinbar that points move up. It is also on the daily support trend line which adds more to the bullish scenario.
XAUUSD Chart Forecast
While we have daily Pinbar on the support trend line and we have the price above strong support level $1725.11 we could expect the price move higher. The price could make a pullback to one of the support levels which we can see on the chart.
Those are $1725.11 as the main one and second one at $1712.64 which is now confluence level of support. We have horizontal support line and uptrend support line.
As we have seen that the price can fluctuate a lot, we should be careful when deciding to enter into the trade. To protect yourself you should put stop loss on each trade.
Disclaimer: Any Advice or information is General Advice Only – It does not take into account your personal circumstances, please do not trade or invest based solely on this information. By ...
more

