Wednesday, June 17, 2020 10:23 AM EDT
USD/CAD – CAUGHT IN A MOVING AVERAGE PINCER MOVEMENT
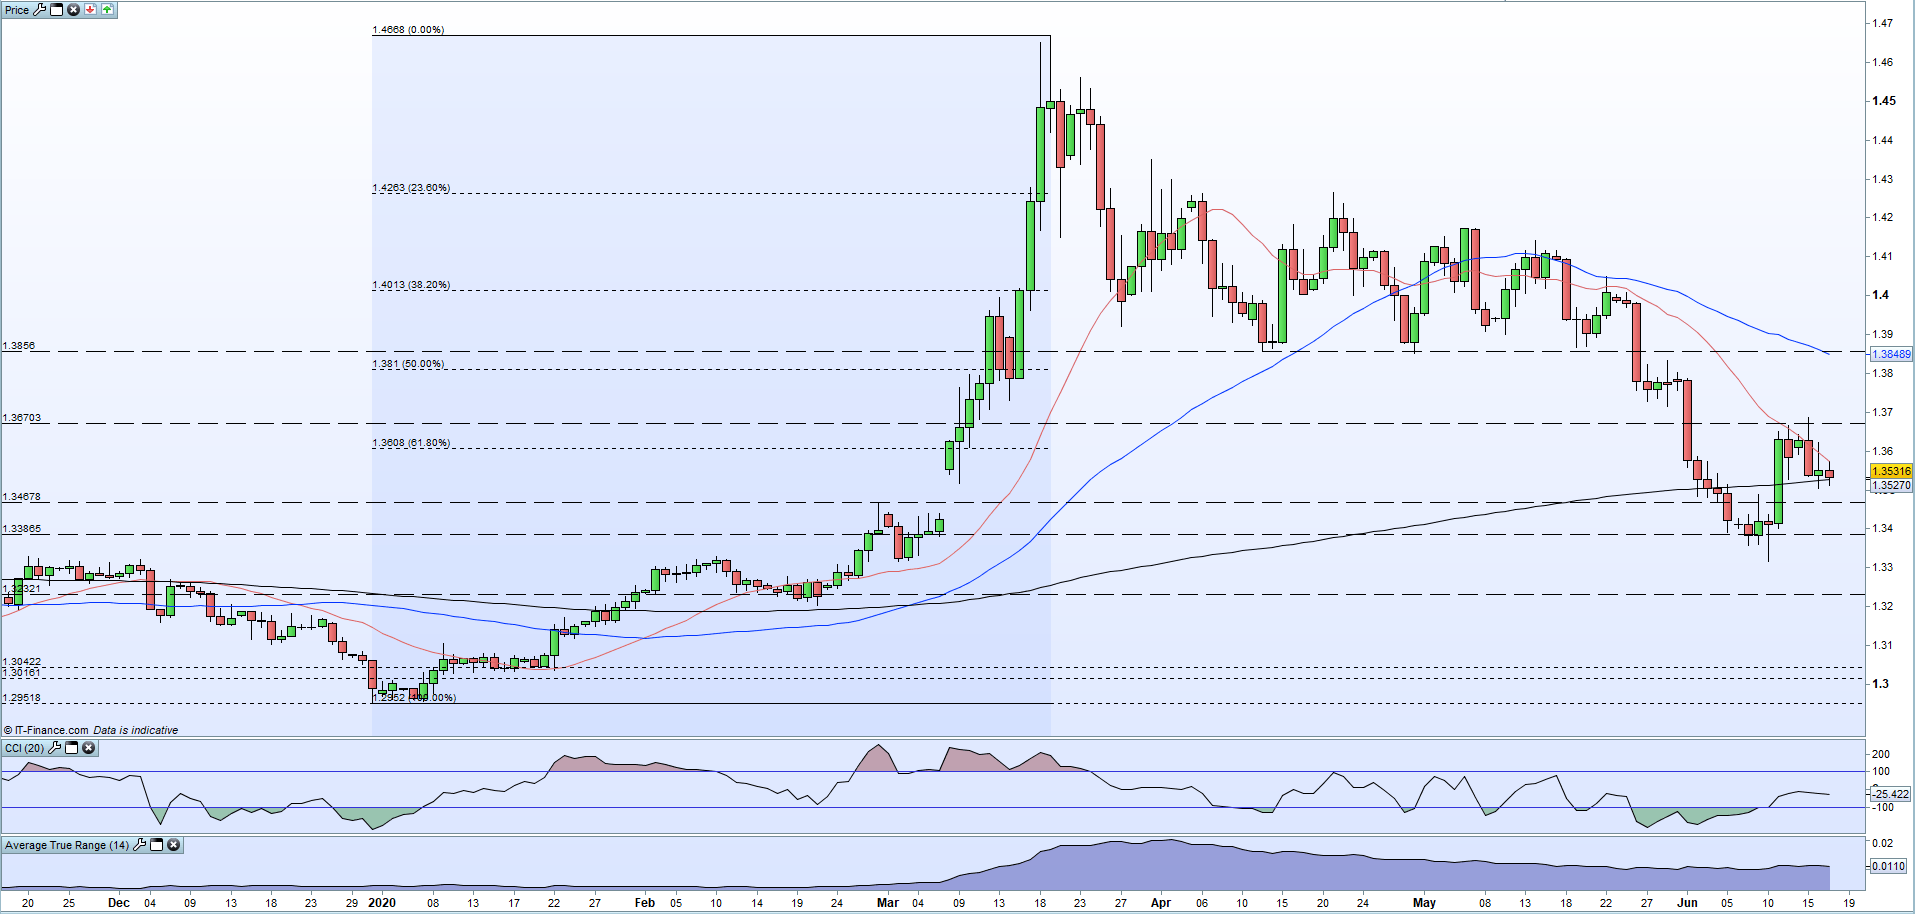
The Canadian dollar’s multi-month rally against its neighbor continues and the pair are now pressing down on the 200-day moving average again. This indicator has underpinned USD/CAD since late-January this year until the early-June break and rebound. If the 200-dma gives way again, USD/CAD may find it harder to regain the long-term moving average and further losses look increasingly likely. Keeping with moving averages, the 20-dma is now in play and has acted as resistance over the last week. With the 20-dma and the 200-dma close to crossing over, one of these indicators is going to have to give in the next few days.
Canadian data spread out over the rest of the week may be a catalyst for the next move, with today’s inflation reading (13:30 UK), Thursday’s ADP employment change and new house price index (13:30 UK) and Friday’s retail sales (13:30 UK) all potential sparks of volatility. Add into the mix the current US dollar price action – nudging higher but with little conviction – and today’s tight trading range and it looks likely that USD/CAD will make a breakout in the near-term.
Resistance levels start at 1.3548 (20-dma) ahead of the 61.8% Fibonacci retracement level at 1.3608 and Monday’s 1.3690 print. Short-term support starts at 1.3528 (200-dma), followed by a few recent lows before the June 10 multi-week low at 1.3314 comes into focus.
USD/CAD DAILY PRICE CHART (NOVEMBER 2019 – JUNE 17, 2020)
(Click on image to enlarge)
Disclaimer: DailyFX, the free news and research website from IG, is one of the world's leading sources for news and analysis on the ...
more
Disclaimer: DailyFX, the free news and research website from IG, is one of the world's leading sources for news and analysis on the currency, commodity and index trading community. With nine internationally-based analysts publishing over 30 articles and producing 5 video news updates daily, DailyFX offers in-depth coverage of price action, predictions of likely market moves, and exhaustive interpretations of salient economic and political developments. DailyFX is also home to one of the most powerful economic calendars available on the web, complete with advanced sorting capabilities, detailed descriptions of upcoming events on the economic docket, and projections of how economic report data will impact the markets. Combined with the free charts and live rate updates featured on DailyFX, the DailyFX economic calendar is an invaluable resource for traders who heavily rely on the news for their trading strategies. Additionally, DailyFX serves as a portal to one of the most vibrant online discussion forums in the forex trading community. Avoiding market noise and the irrelevant personal commentary that plague many forex blogs and forums, the DailyFX Forum has established a reputation as being a place where real traders go to talk about serious trading.
Any opinions, news, research, analyses, prices, or other information contained on dailyfx.com are provided as general market commentary and does not constitute investment advice. Dailyfx will not accept liability for any loss or damage, including without limitation to, any loss of profit, which may arise directly or indirectly from use of or reliance on such information.
less
How did you like this article? Let us know so we can better customize your reading experience.


