
Canadian Dollar Price Outlook: USD/CAD Range Support, Trend On Pause
USD/CAD HOLDS AT RANGE SUPPORT AS TRENDS TAKE A PAUSE, FOR NOW
USD/CAD is holding at a key spot of support this morning, even as the US Dollar pitches down to a fresh near-term low. This comes on the heels of a concerted one-sided trend that had developed in the pair in late-May, driving through the first ten days of June as USD/CAD re-tested the March lows.
After bottoming out around 1.3315, USD/CAD put in a 50% retracement of that trend over the next five days, eventually topping-out just inside of the 1.3700 handle; this was followed by a quick trip down for another support test around 1.3500. Since then and over the past week, USD/CAD has been range-bound, caught between this key area of confluent support and the approximate area around 1.3600.
USD/CAD HOURLY PRICE CHART
(Click on image to enlarge)
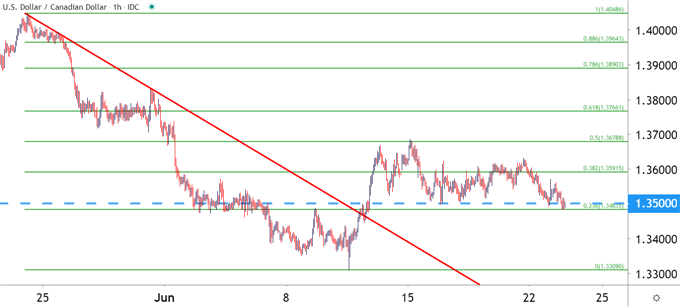
Chart prepared by James Stanley; USDCAD on Tradingview
Taking a step back to the four-hour chart highlights the importance of the current zone of support. The 23.6% Fibonacci retracement from the major move looked at above plots at 1.3483, which has helped to hold the lows through a couple of different tests already this morning. But, also of interest is the 1.3462 level, which is the 61.8% retracement from a long-term major move, taking the high from the year 2002 and plotted down to the 2007 low. And, of course, the 1.3500 psychological level looms large, although it has been traded through of recent; but it does add weight to the prospect of continuation of support around this zone given that there are multiple reasons for buyers to defend.
This support hold has shown even as the US Dollar has been in a hard-sell mode so far this week; highlighting the fact that USD/CAD could possibly be of interest for long-USD plays; as the additional CAD weakness that’s helped the pair to move sideways could see significant benefit should prospects brighten for a bullish theme in the USD.
USD/CAD FOUR-HOUR PRICE CHART
(Click on image to enlarge)
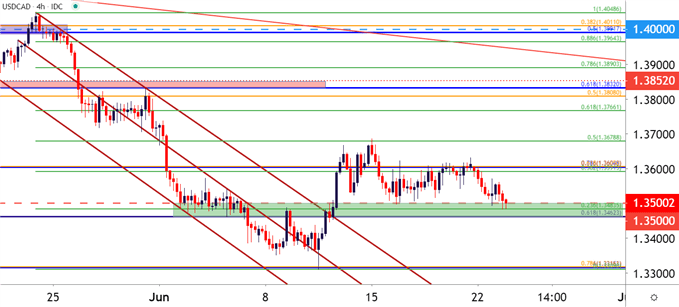
Chart prepared by James Stanley; USDCAD on Tradingview
USD/CAD BEARISH ARGUMENT
The bearish side of USD/CAD could be approached with the aim of short-term breakouts, looking for the lower-highs that have posted over the past week, combined with horizontal support, to allow for a short-side break. This would be very similar to a descending triangle formation, looking for the same motivation that’s brought in sellers at higher-lows to, eventually, take over to allow for a breakthrough horizontal support. I say similar to a descending triangle because the lower-highs aren’t well defined, given that there are just two points identified on the trendline in the below chart.
The next obvious area of support beyond the current zone would be around the June lows in the 1.3300 vicinity; but there may be some additional support potential around 1.3365 given recent price action. This argument would likely need some element of continued cooperation from the USD, looking for a prolonged breakdown in the US Dollar as sellers continue the trend that was so visible from late-May through early-June.
USD/CAD TWO-HOUR PRICE CHART
(Click on image to enlarge)
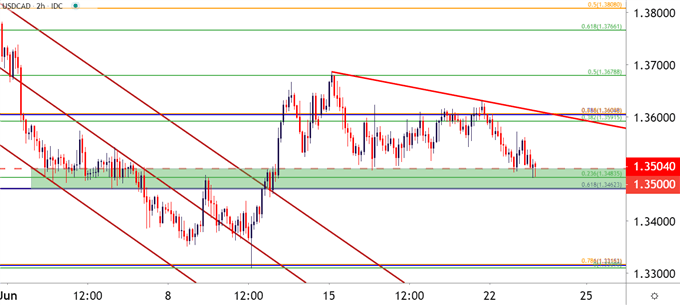
Chart prepared by James Stanley; USDCAD on Tradingview


