


Join Our Telegram channel to stay up to date on breaking news coverage
Bitcoin (BTC) Price Prediction – July 2
For the past few days, Bitcoin (BTC) tried to break above the $9,500 mark but with no success.
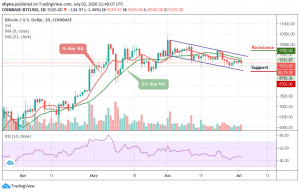
BTC/USD Long-term Trend: Bearish (Daily Chart)
Key levels:
Resistance Levels: $9,700, $9,900, $10,100
Support Levels: $8,700, $8,500, $8,300

BTC/USD is pulling a shocking and devastating move against bullish investors following a tremendous fall from $9,251 to touch the low of today at $8,918.62. At the time of writing, BTC/USD is trading 1.46% lower on the day and hovers at $9,105. However, the bulls fail to breach the $9,300 psychological level which happens to be one of the reasons why the coin is facing a downward trend.
Moreover, as the coin is trading at $9,105 displaying an intraday loss of 1.46%. The prevailing trend is bearish with expanding volatility. Therefore, a break below the lower boundary of the channel may likely continue in the direction of the downtrend. In this case, BTC/USD could fall below $8,800 support and further movement may hit the critical supports at $8,700, $8,500, and $8,300.
However, if the bulls can hold the price to remain around the 9-day and 21-day moving averages, moving up could push the price above the upper boundary of the channel and move to $9,700 vital resistance. A further high drive could send the coin to $9,900, and $10,100 resistance levels. Unfortunately, the technical indicator RSI (14) is revealing a sign of trend reversal, which shows a possible bearish momentum in the market.
BTC/USD Medium – Term Trend: Bullish (4H Chart)
On the 4 hour chart, BTC/USD is trading at $9,134 as all eyes are glued on the $9,500 resistance level. Looking at the chart currently, the coin is seen moving towards the 9-day moving averages and 21-day moving averages while the existing trend is still bullish. This suggests that buyers could remain in the driver seat but rapid price actions may need to play out.
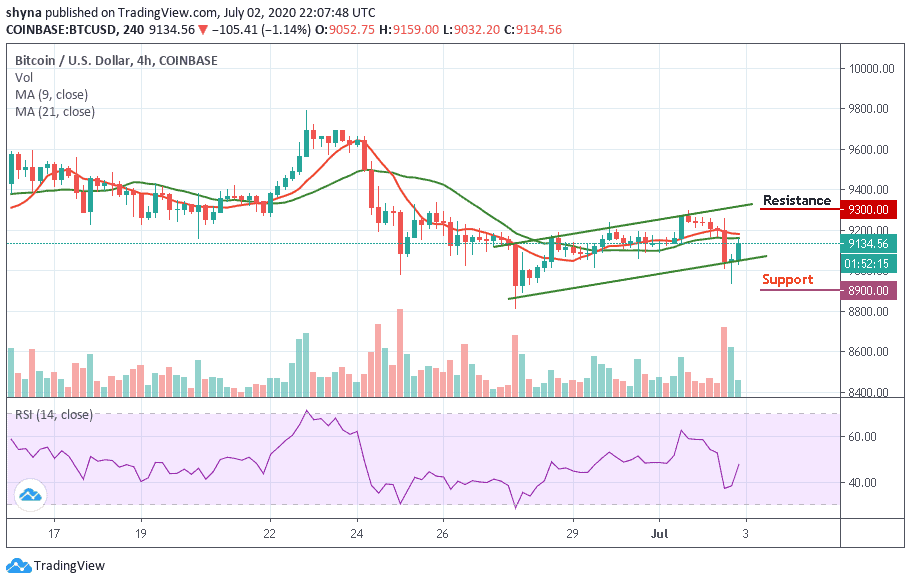
However, at the time of writing, the Bitcoin price is recovering above $9,000 level amidst fresh buying impetus. More so, the bullish trend line remained unbroken, which is why Bitcoin’s priority still remains the same and the coin may likely retest the $9,500 mark next. Meanwhile, if the technical indicator RSI (14) continues to follow the upward movement, the coin may likely reach the resistance level of $9,300 and above while the support level to watch lies at $8,900 and below.
Join Our Telegram channel to stay up to date on breaking news coverage
