Join Our Telegram channel to stay up to date on breaking news coverage
Bitcoin (BTC) Price Prediction – July 4, 2020
After a week of fluctuation above $9,000, BTC/USD rebounded above the $9,000 support to set the stage for an upside range trading. In the interim, it is unlikely for a possible downtrend. The upside trading will commence if the $9,000 -$9,200 support holds.
Key Levels:
Resistance Levels: $10,000, $11, 000, $12,000
Support Levels: $7,000, $6,000, $5,000
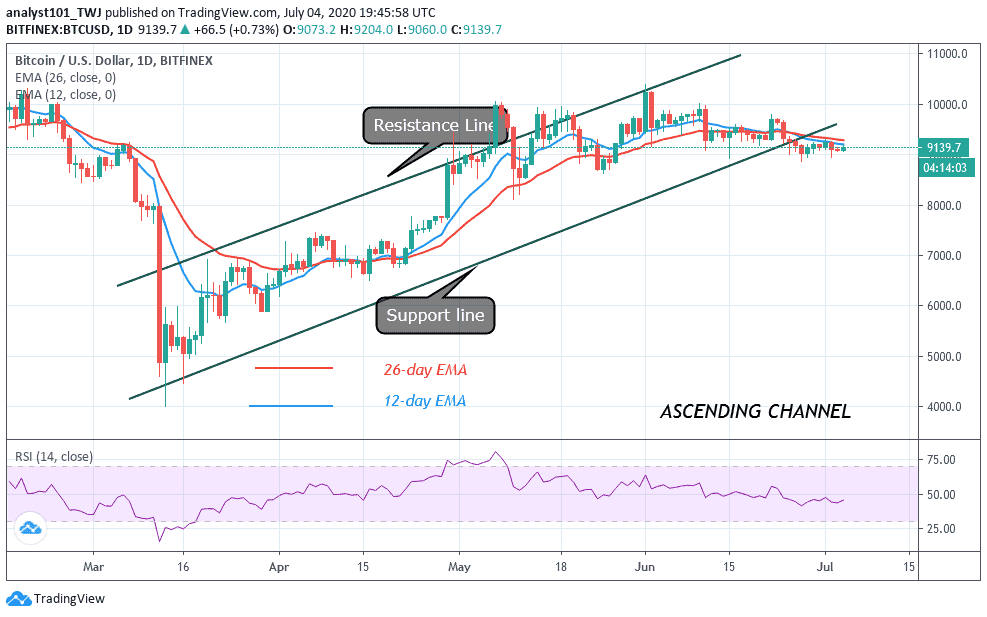
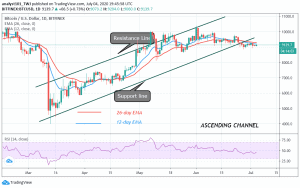
Bitcoin bulls have overcome the bears above the $9,000 support. The bulls have survived the downward threat after breaking above the $9,100. As long as price is above the EMAs, the upward move will continue. Nonetheless, buyers have a second hurdle to jump over if the upside range trading will commence. As the market continues its upward move, the bulls have to break the $9,300 resistance to begin its upside range trading. BTC will rise and begin its fluctuation between $9,300 and $9,800, if buyers are successful over the $9,300 resistance. A break above the $9,800 resistance will accelerate price to retest the $10,000 overhead resistance. A possible rally to $11,600 is likely if the bulls overcome the $10,000 overhead resistance.
Conversely, if the bulls face rejection at the $9,300 resistance, there will be a bearish reaction. A downward movement of the coin is possible if the $9,000 – $9,200 support fails to hold. After the $9,000 region is broken, the downtrend will resume to $8,825 low. The bearish momentum will continue to $8,600. Possibly, the coin will reach a low of $8,100 if the previous support is broken. However, if the support at the lower region of $9,000 $holds, there is a likelihood of a retest at the $9,300 resistance until it is breached. Bitcoin is at level 43 of the Relative Strength Index period 14. This implies that BTC is still in the bearish trend zone and it is likely to fall.
BTC/USD Medium-term Trend: Bullish (4-Hour Chart)
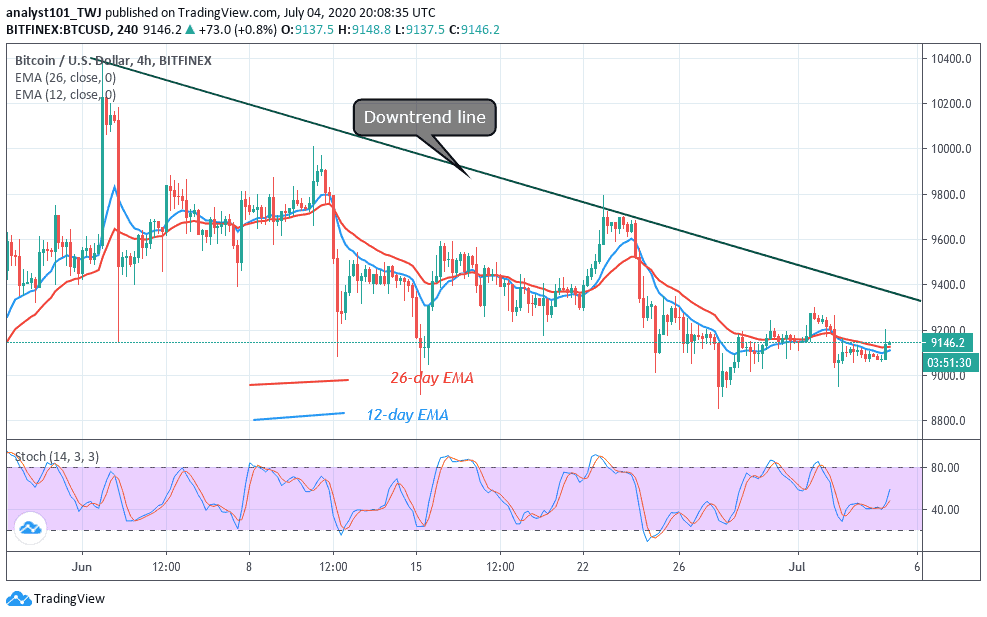
On the 4 hour chart, BTC rebounded to reach the $9,200 resistance. Presently, the bulls could not sustain the upward move as price makes a downward move. The bottom line is that the lower region of $9,000 must hold for an upside range trading. Today, after the rebound, Bitcoin reached a high of $9,200 but has fallen to $9,136 at the time of writing. BTC is presently above 40 % range of the daily stochastic. It indicates that the market is in a bullish momentum. The price action is indicating bullish signals.
Join Our Telegram channel to stay up to date on breaking news coverage