Join Our Telegram channel to stay up to date on breaking news coverage
Litecoin (LTC) Price Prediction – July 6
Litecoin adds 5.82% in a day, and at the time of writing, it is trading around $44.01.
LTC/USD Market
Key Levels:
Resistance levels: $47, $48, $49
Support levels: $39, $38, $37

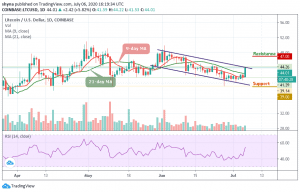
LTC/USD is seen fetching a decent hike in the last 24 hours that took the coin around $44 after a while. The coin is already on a path of price recovery after the drops of yesterday. The Litecoin (LTC) is one of the most emerging coins of the market, and it is likely to touch $45 in the coming days as its next resistance. The long-term outlook is likely to be bullish.
However, as the trading volume is coming up gradually, the coin is trading above the 9-day and 21-day moving averages within the descending channel. On the upside, if the price breaks above the channel and closes above it, LTC/USD may likely continue its uptrend and could reach the resistance levels of $47, $48, and $49.
Moreover, as the market fluctuates, there is the tendency of the bears breaking below the moving averages to touch the support of $40 in as much as the 21-day MA is above the 9-day MA, the bears may likely step back into the market which may hit the nearest support levels at $35, $30, and $25 respectively. Technically, the RSI (14) is crossing the 50-level, suggesting more bullish signals.
Against Bitcoin, Litecoin has remained fairly static. However, we have seen an increase from 4573 SAT to 4724 SAT today where the resistance was found. The recent increase has also allowed the cryptocurrency to climb above the 9-day and 21-day moving averages which is a promising sign for buyers.
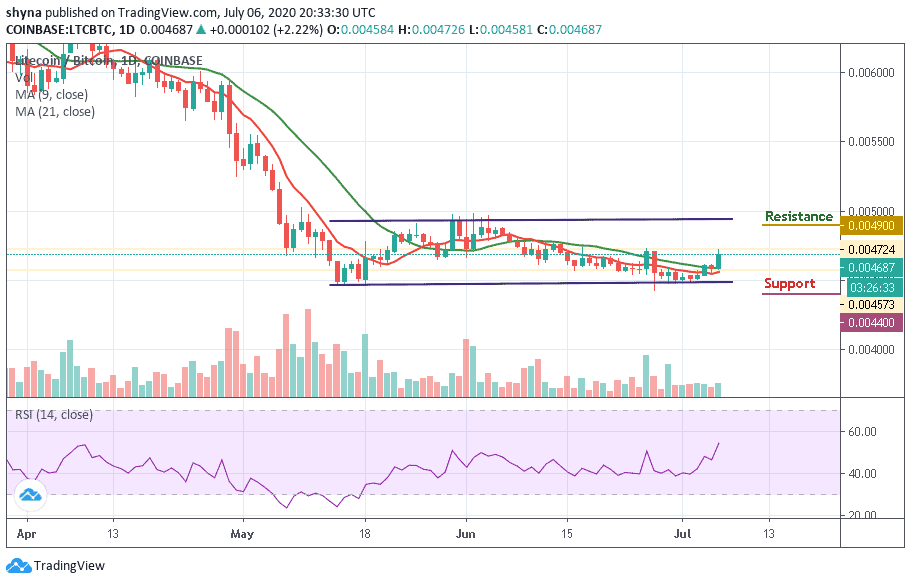
From above, if the bulls can break above 4800 SAT, higher resistance is then located at 4900 SAT and 5000 SAT. From below, the nearest level of support now lies below the channel. Beneath this, further support is at 4400 SAT and 4300 SAT respectively. However, the RSI (14) is breaking above the 53-level which is a promising sign for the bulls as the momentum is on their side.
Join Our Telegram channel to stay up to date on breaking news coverage