Join Our Telegram channel to stay up to date on breaking news coverage
ETH Price Prediction – July 9
The Ethereum price is facing a fresh round of selling as the price remains at a risk of more downsides if it breaks the $235 support zone.
ETH/USD Market
Key Levels:
Resistance levels: $265, $270, $275
Support levels: $220, $215, $210

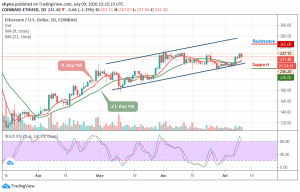
A few days ago, ETH/USD price was around its usual resistance level at $242.26, from where it rose to the following at $244.08. Towards the next day, ETH mounted as high as $248.32 just to start plunging earlier today and have a falling wedge pattern formed.
However, ETH/USD is trading above the moving averages of 9 and 21 days at $241 as at the time of writing, having trying to recover from the intraday low of $236.20. The second-largest crypto, with a current market value of $ 27.08 billion is seen losing about 2.29% of its value since the beginning of today and has remained virtually unchanged from day-to-day.
The Ethereum price continues to follow the downtrend but still within the ascending channel and any attempt to break below the channel, the bears may have potential support at $220, $215, and $210 levels. Conversely, if the bulls push the price and maintain the upward movement within the channel, the buyers may likely find resistance at $265, $270, and $275.
Meanwhile, the stochastic RSI signal lines are still within the overbought zone, more losses may play out when coming down.
Against Bitcoin, the Ethereum price remains in the ascending channel but the bears are trying to step back into the market. ETH/BTC is currently trading at the level of 0.0261 BTC and the bulls couldn’t push the price above the channel. Looking at the chart, if the market continues to drop, the next key supports may likely be at 0.0245 BTC and below.

However, on the upside, a possible bullish movement may likely push the market above the ascending channel, when this is done, the resistance level of 0.0270 BTC and above may be visited. The stochastic RSI is within the overbought zone and this is to indicate that the market will begin to fall once it faces down.
Join Our Telegram channel to stay up to date on breaking news coverage