Join Our Telegram channel to stay up to date on breaking news coverage
Bitcoin (BTC) Price Prediction – July 11, 2020
Bitcoin bulls broke the $9,300 and $9,400 resistance but fail to sustain the upward move. Consequently, BTC dropped below $9,200 and resume consolidation. BTC/USD will continue to consolidate sideways as long as the $9,000 and $9,200 support holds.
Key Levels:
Resistance Levels: $10,000, $11, 000, $12,000
Support Levels: $7,000, $6,000, $5,000
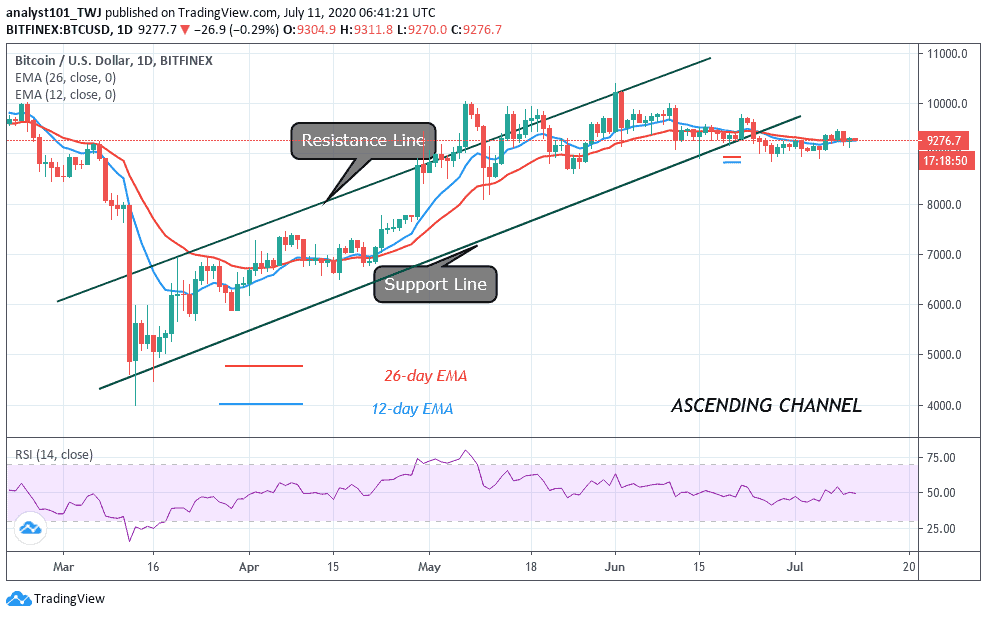
In the earlier uptrend, buyers were able to break the resistance at $9,300 and $9,400 but found penetration difficult at $9,500 resistance. After a recent drop on July 9, the price corrected upward to revisit the previous highs. This time if the bulls clear the $9,500 resistance, the price movement will accelerate on the upside. In the upside range trading, the market fluctuates between $9,300 and $9,800 before retesting the $10,000 overhead resistance.
However, the $9,800 resistance must be broken before having access to the $10,000 overhead resistance. In the meantime, BTC has dropped to the lower region of $9,000. Price has corrected upward to resume the second uptrend. Buyers are attempting to push above the $9,300 resistance. The bears are reacting as price is being repelled at the recent high. On the upside, if the bull fails to push BTC above $9,300, a drop to the lower region of $9,000 is unavoidable. The king coin will fall and resume consolidation above the $9,000 region. Meanwhile, BTC has risen to level 50 of the Relative Strength Index period 14. It indicates that the crypto is in the uptrend zone.
BTC/USD Medium-term Trend: Bullish (4-Hour Chart)
On the 4 hour chart, Bitcoin risks another drop to $9,000 support. In the first upward move, the bulls cleared the $9,300 and $9,400 resistance but faced rejection at the $9,500 resistance.
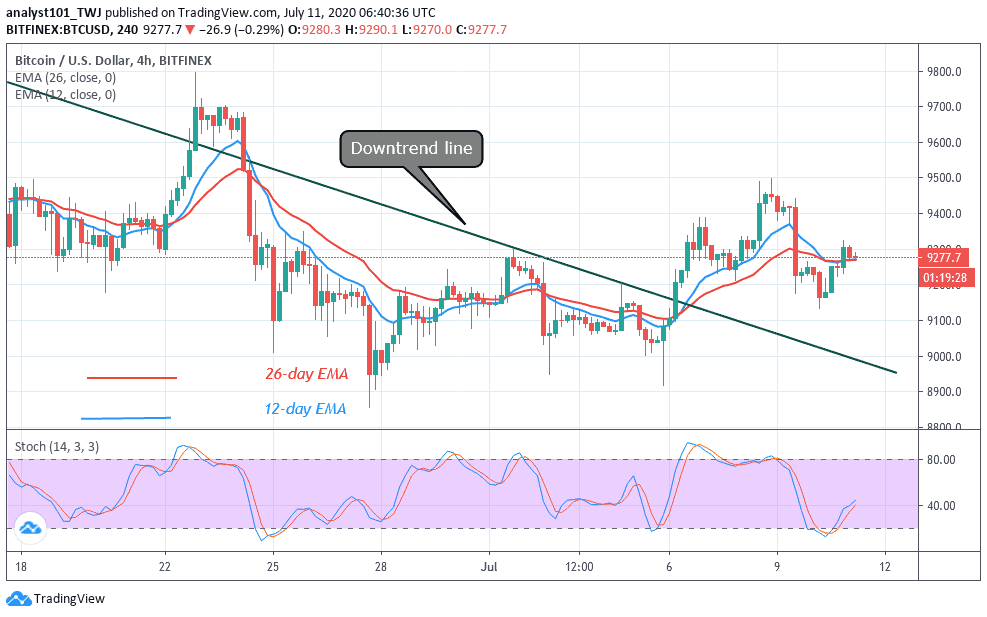
Consequently, price dropped to $9,133 low and corrected upward to reach the $9,300 resistance. After the retest at the $9,300 resistance, BTC resumed a downward move. Nonetheless, if the $9,000 and $9,200 support holds, BTC will resume its sideways movement above $9,000 support. The king coin is above 40% range of the daily stochastic. It indicates that the market is in a bullish momentum. In the meantime, this is contrary to the price action that indicates a bearish signal.
Join Our Telegram channel to stay up to date on breaking news coverage