
Advertisement
Advertisement
EUR/AUD Flag Pattern Aims at 1.69 in Bullish Reversal
By:
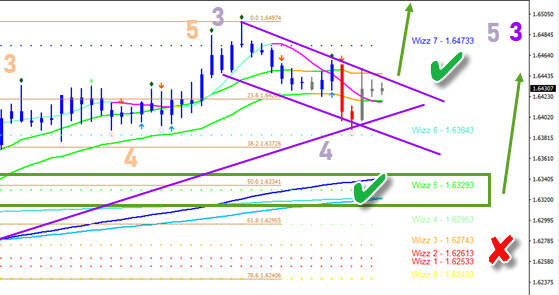
EUR/AUD is building a bull flag chart pattern. The pullback occurs after a strong push up. This indicates that a wave 3-4 pattern is taking place.

In this article:
The EUR/AUD is building a bull flag chart pattern. The pullback occurs after a strong push up. This indicates that a wave 3-4 pattern is taking place.
Price Charts and Technical Analysis
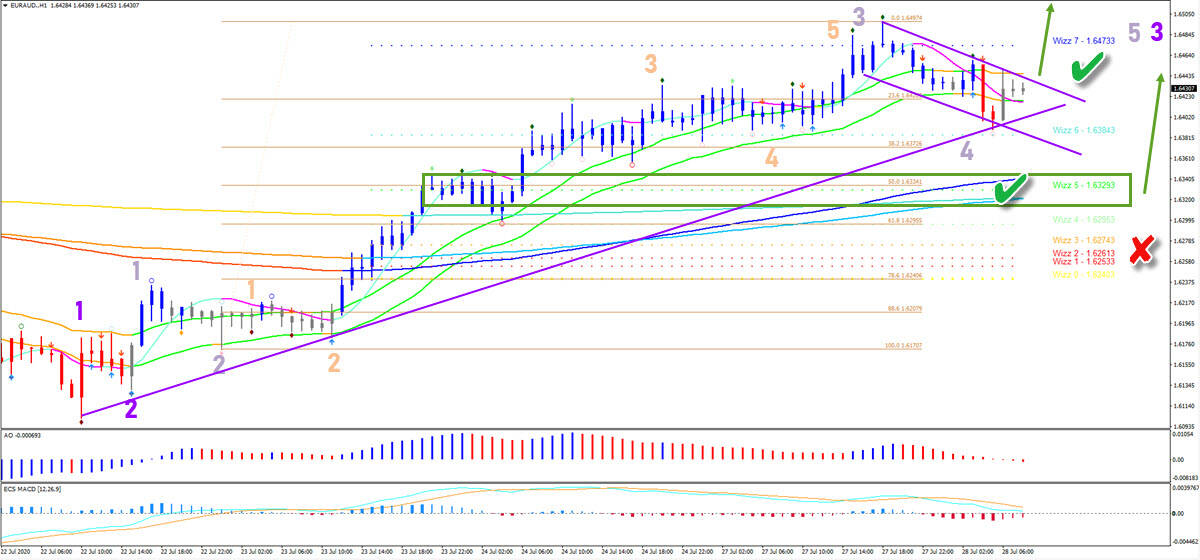
The EUER/AUD is expected to continue with the uptrend. But price must remain above the support zone (green box). This includes the 50-61.8% Fibonacci zone, the long-term moving averages, and support levels from the previous consolidation zone.
A bearish break below the support invalidates (red x) the bullish outlook. A bullish bounce at support or break above the flag pattern confirms (green check) it. The main targets for any upside price movement are: Wizz 8 at 1.66 and Fibonacci retracement levels from the weekly chart at 1.69 and 1.75.
Good trading,
Chris Svorcik
The analysis has been done with the indicators and template from the SWAT method (simple wave analysis and trading). For more daily technical and wave analysis and updates, sign-up to our newsletter
For a look at all of today’s economic events, check out our economic calendar.
About the Author
Chris Svorcikcontributor
Chris Svorcik is co-founder, trader, and analyst with Elite CurrenSea (www.EliteCurrenSea.com) since 2014.
Did you find this article useful?
Latest news and analysis


Advertisement