


Join Our Telegram channel to stay up to date on breaking news coverage
LTC Price Prediction – July 30
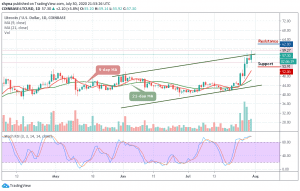
LTC/USD is changing hands at $57.30, moving within a short-term bullish trend amid low volatility.
LTC/USD Market
Key Levels:
Resistance levels: $62, $64, $66
Support levels: $52, $50, $48
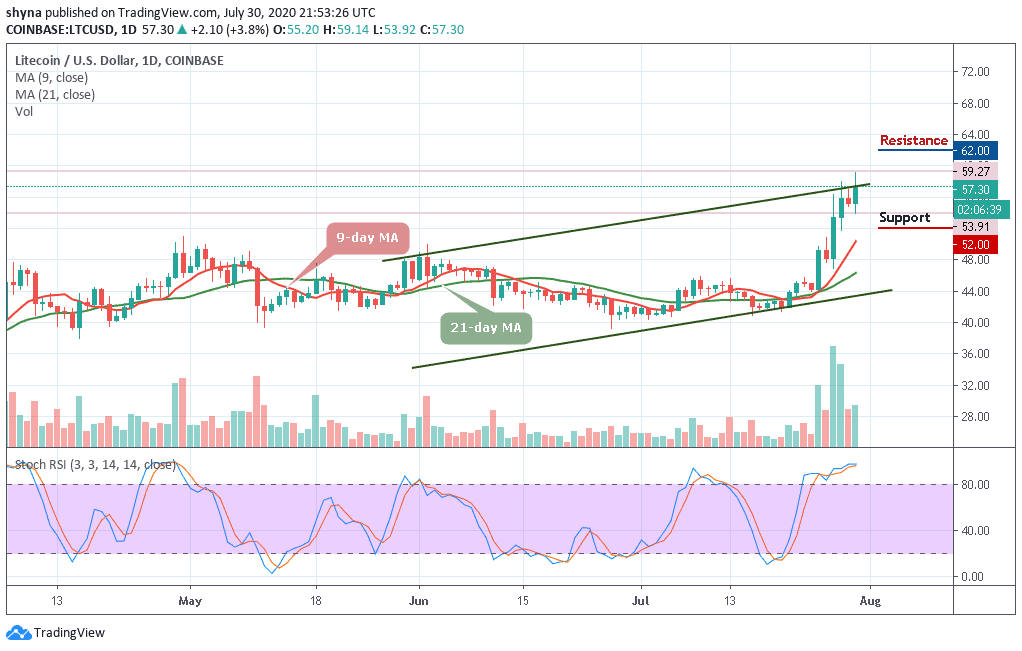
LTC/USD is trading in the green in today’s session, moving within the ascending channel where the coin has gained over 3.8%. LTC/USD breaks above the channel to touch the daily high of $59.27. A sustainable move above $60 may create a strong bullish impulse to push the price to the highest level of $62, $64, and $66 resistance.
The Litecoin price is settling above $55 after the recent breakout stalled at $59. Generally, the market is taking a step back after recording gains for a few days. Technically, buyers still have the upper hand as per the trend observed using the stochastic RSI indicator. Meanwhile, the bulls lack the energy to push the coin farther up.
However, a break below the $55 support level may provoke an even deeper decline towards the $52, $50, and $48 support levels. Nevertheless, if the bulls retain control of the market, they should be able to push LTC/USD above the $60 psychological level.
Moreover, the bulls are making more effort to push the price across the ascending channel, and then if this is done, it’s likely for the price to reach the resistance levels of $48, $50, and $52 respectively. However, the movement above these resistance levels may encourage further Litecoin buying.
Against Bitcoin, LTC is making an attempt to cross the upper boundary of the ascending channel in other to retest the resistance at 5300 SAT. Unless this resistance is effectively exceeded and the price eventually closes above it, there might not be any reason to expect the long-term bullish reversal.
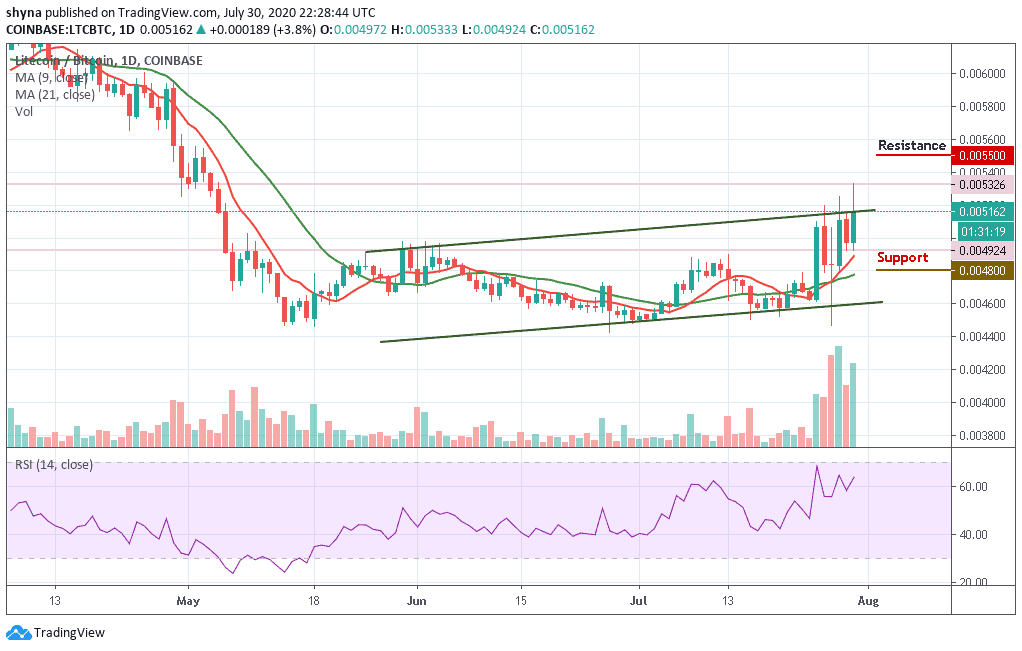
However, trading below the 9-day and 21-day moving averages could refresh lows under 5000 SAT and a possible bearish continuation may likely meet the major support at 4900 SAT before falling to 4800 SAT and below while the buyers may push the market to the critical potential resistances at 5500 SAT and above as the RSI (14) trades above 60-level to give more bullish signals.
Join Our Telegram channel to stay up to date on breaking news coverage
