
Advertisement
Advertisement
AUD/NZD Bearish Break Offers Wide Open Space to Fib Levels
By:
AUD/NZD has been in range for more than 5 year on the monthly chart. Price is now showing a potential bearish breakout with 100-300 pips space.

In this article:
The AUD/NZD has been in range for more than 5 year on the monthly chart (price action hitting the 21 ema zone). Price is now showing a potential bearish breakout with 100-300 pips space.
But the Fibonacci levels could also act as support zones… Let’s review the monthly and 4 hour charts.
Price Charts and Technical Analysis
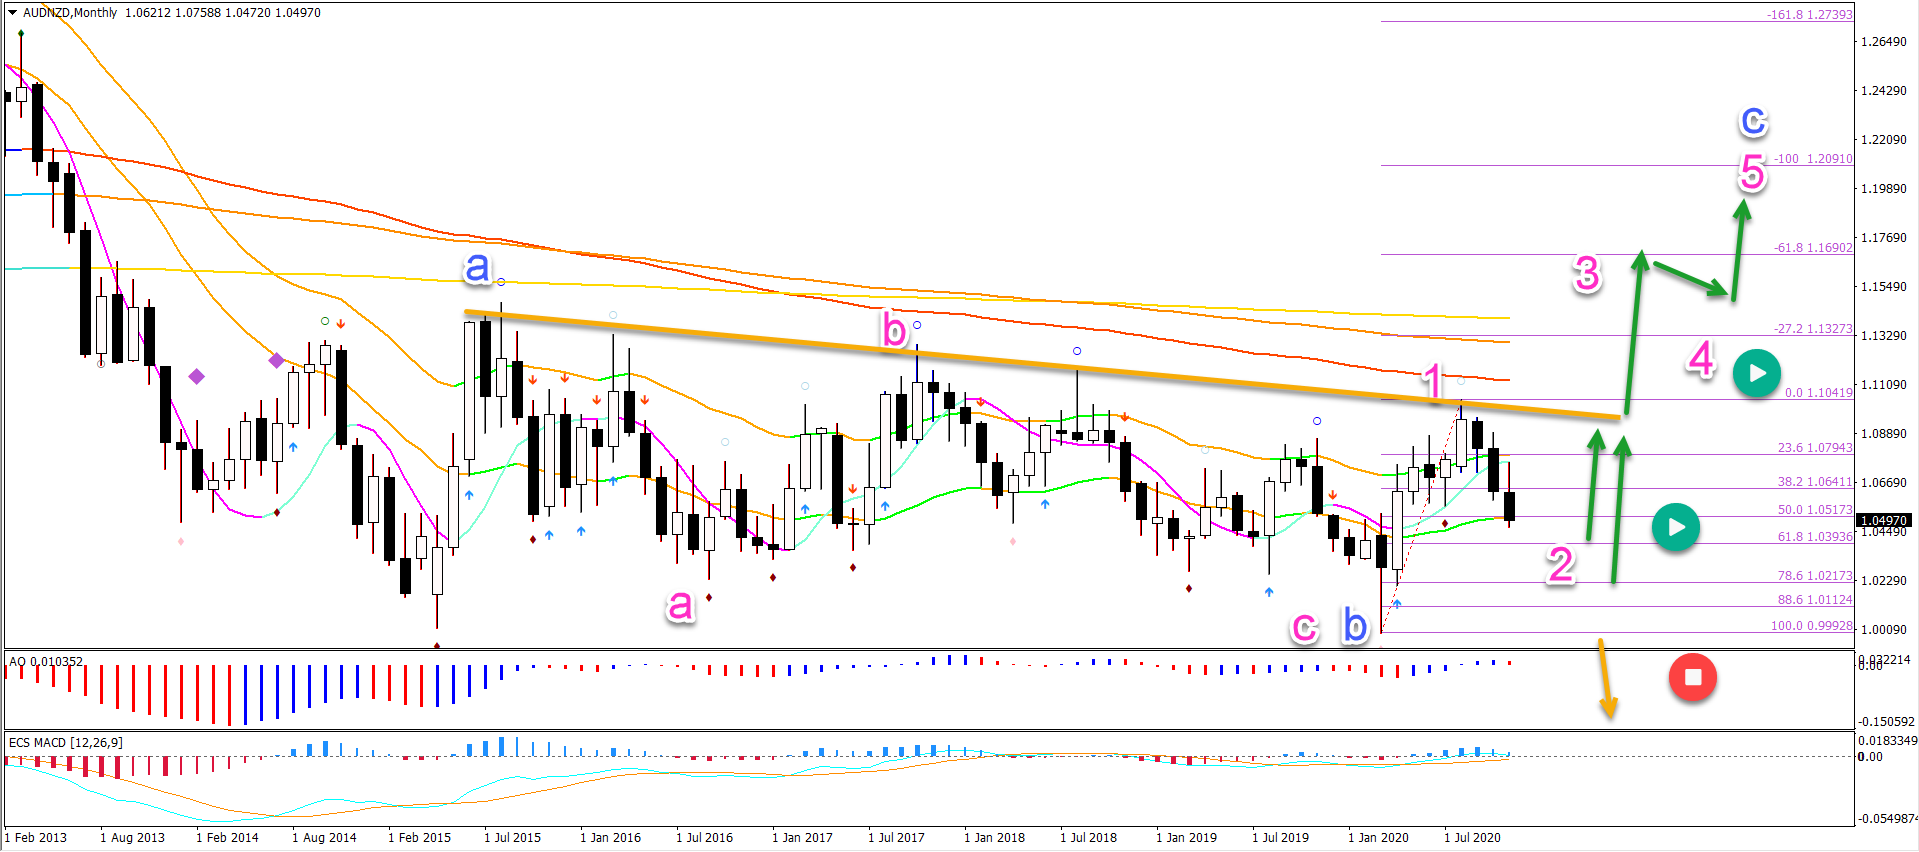
The AUD/NZD seems to be building a large ABC (blue) pattern. Although this wave outlook is fragile to the choppy consolidation zone.
If a larger wave C (blue) does occur, then price is expected to make a bullish bounce at the Fibonacci retracement levels. Price should also break above the resistance trend line (orange) if a 5 wave pattern emerges (pink).
A break below the bottom invalidates (red circle) the bullish outlook. This confirms a bearish breakout below the range and also a full downtrend.
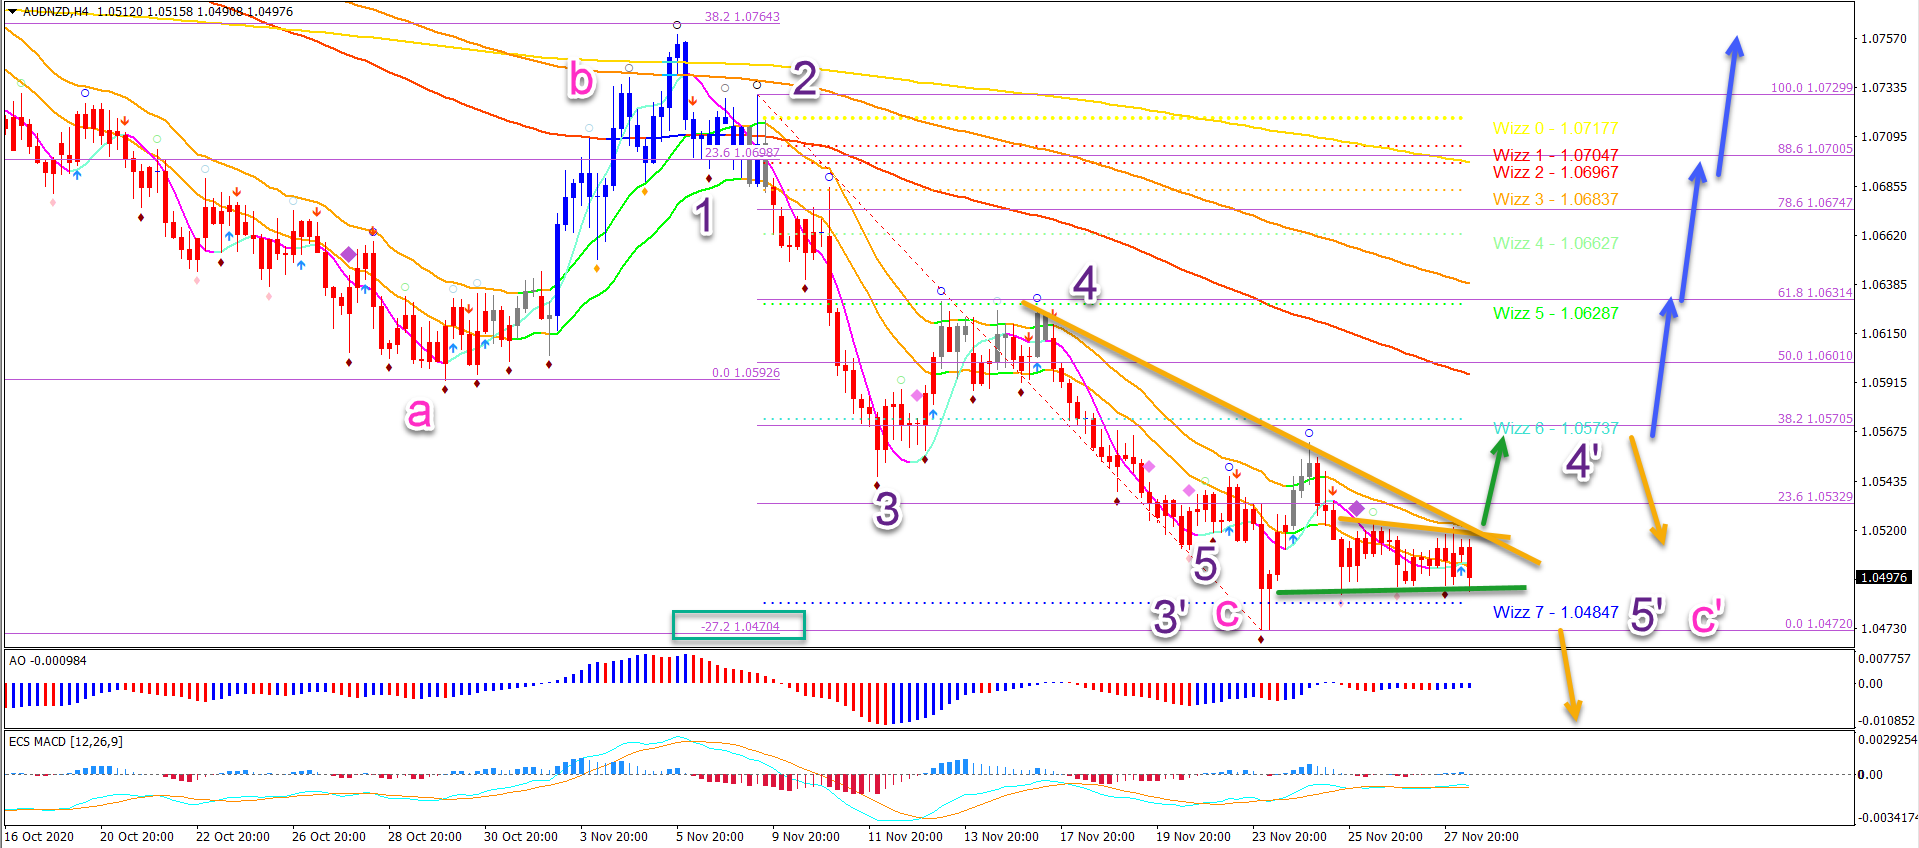
On the 4 hour chart, price could have completed a wave 5 (purple) of a larger ABC (pink) pattern at the -27.2% Fibonacci target (green box) and 50% Fib on the monthly chart.
- But price action must break above the 21 ema zone and then the 38.2% resistance Fib to confirm that (blue arrows).
- A bearish breakout below the support zone (green line) or a bearish bounce at the 38.2% Fibonacci zone could confirm the bearish outlook.
It remains likely that price action will move lower to test at least the 61.8% Fib at 1.04 if not the 78.6% Fibonacci retracement level at 1.0220 on the monthly chart. Also, the -61.8% Fibonacci targets form a confluence at 1.0310.
Good trading,
Chris Svorcik
The analysis has been done with the indicators and template from the SWAT method (simple wave analysis and trading). For more daily technical and wave analysis and updates, sign-up to our newsletter
For a look at all of today’s economic events, check out our economic calendar.
About the Author
Chris Svorcikcontributor
Chris Svorcik is co-founder, trader, and analyst with Elite CurrenSea (www.EliteCurrenSea.com) since 2014.
Did you find this article useful?
Latest news and analysis


Advertisement