Join Our Telegram channel to stay up to date on breaking news coverage
BCH Price Prediction – September 9
Bitcoin Cash (BCH) is showing an amazing intraday hike as it rises from a daily low of $218 to currently trading above $226.
BCH/USD Market
Key Levels:
Resistance levels: $255, $265, $275
Support levels: $190, $180, $170
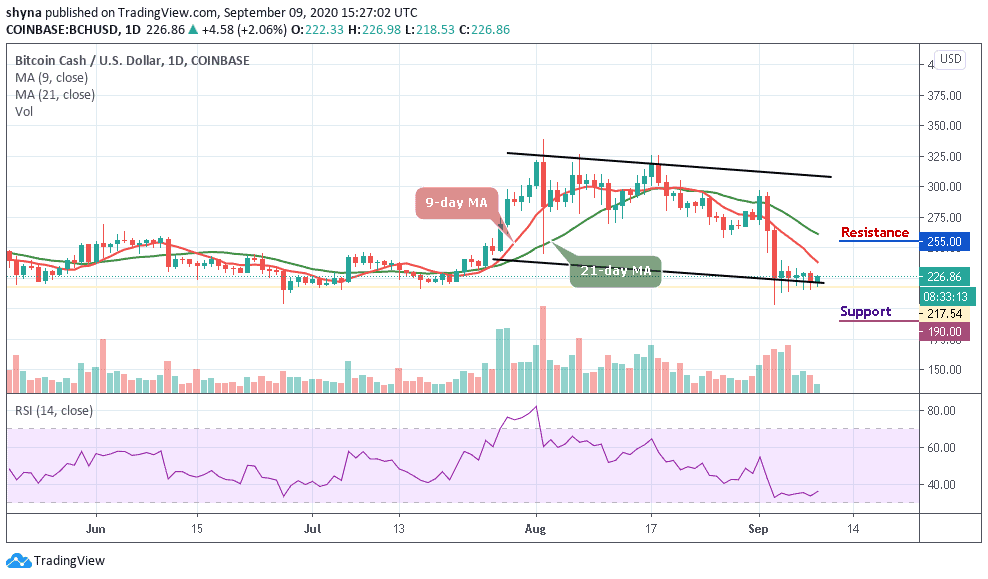
BCH/USD is trading around $226 at the time of writing. The Bitcoin Cash is also seen focusing on the bullish momentum after a sustainable break above an important technical level. More so, the coin is already gaining over 2% since the beginning of the day as it is using $215 support as a jumping-off ground to develop the upside momentum, which is now gaining traction.
What to Expect from Bitcoin Cash (BCH)
On the upside, if BCH/USD cross above the red-line of the 9-day moving average, the market price may break through the resistance level of $245 and $250 respectively. Meanwhile, the technical indicator is showing that the bulls are ready for action especially when the up-trending RSI (14) begins but the MA is yet to give any bullish sign. Moreover, any further bullish movement above the 21-day moving average may pave the way to the resistance levels of $255, $265, and 275.
Nevertheless, if the price falls below the lower boundary of the channel, the market may be compelled either to a range-bound or begin a downward movement. This may likely serve as a major blow for the market sentiments as traders could interpret it as a sign of underlying weakness. The next important support may come at $215, which may be followed by $190, $190, and $170 support levels.
As revealed in the daily chart, against BTC, the bears have shown a little commitment to BCH trading. Following the recent negative sign, the trend may continue to follow the downtrend if the buyers failed to push the price above the 9-day and 21-day moving averages.
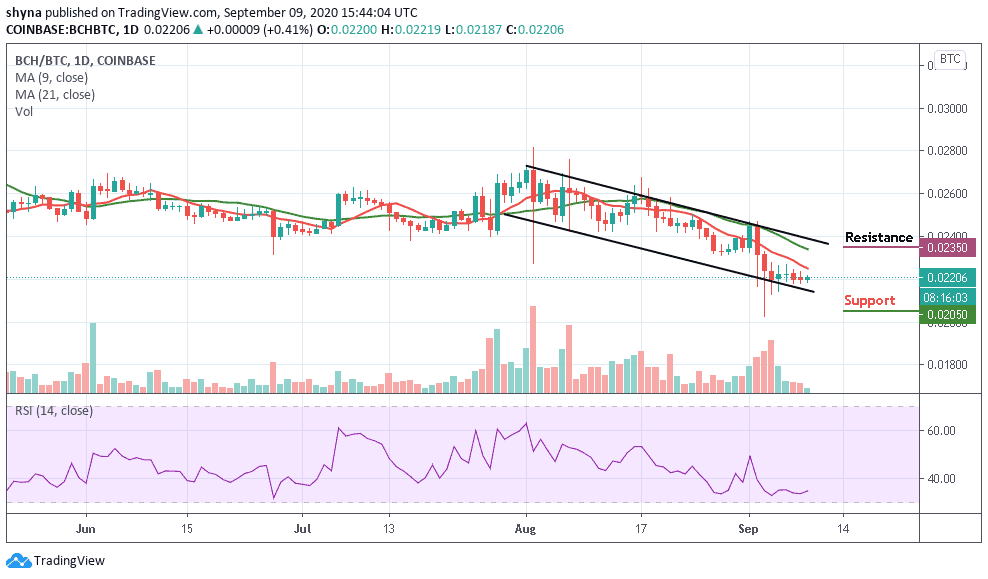
However, as the RSI (14) is hovering around 35-level, once it moves above this level, the market price may likely resume an upward trend to touch the resistance level of 0.0235 BTC and 0.0240 BTC but a retest could lower the price to 0.0205 BTC and 0.0200 BTC support levels.
Join Our Telegram channel to stay up to date on breaking news coverage