Join Our Telegram channel to stay up to date on breaking news coverage
Bitcoin Cash (BCH) Price Prediction – September 19, 2020
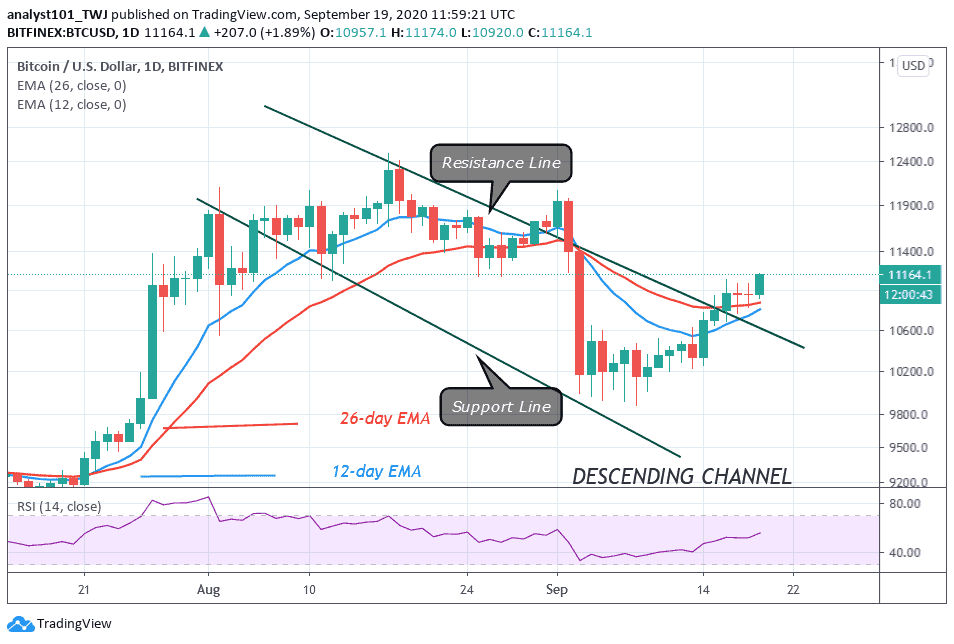
BCH/USD is still falling because it is in the bearish trend zone. The selling pressure has been exhausted temporarily as it consolidates in a tight range between $228 and $240. BCH/BTC has been in a downtrend since February 14.
Key Levels:
Resistance Levels: $280, $320, $340
Support Levels: $200, $160, $120
Bitcoin Cash is trading at $234 at the time of writing. After the last bearish impulse on September 3, BCH was consolidating between $203 and $240. The coin was range-bound for two weeks and the range-bound levels remained unbroken. On September 15, the bulls attempted to break the resistance at $240 but were repelled. The price retraced and resumed consolidating in a narrow range. BCH now consolidates between $228 and $240.
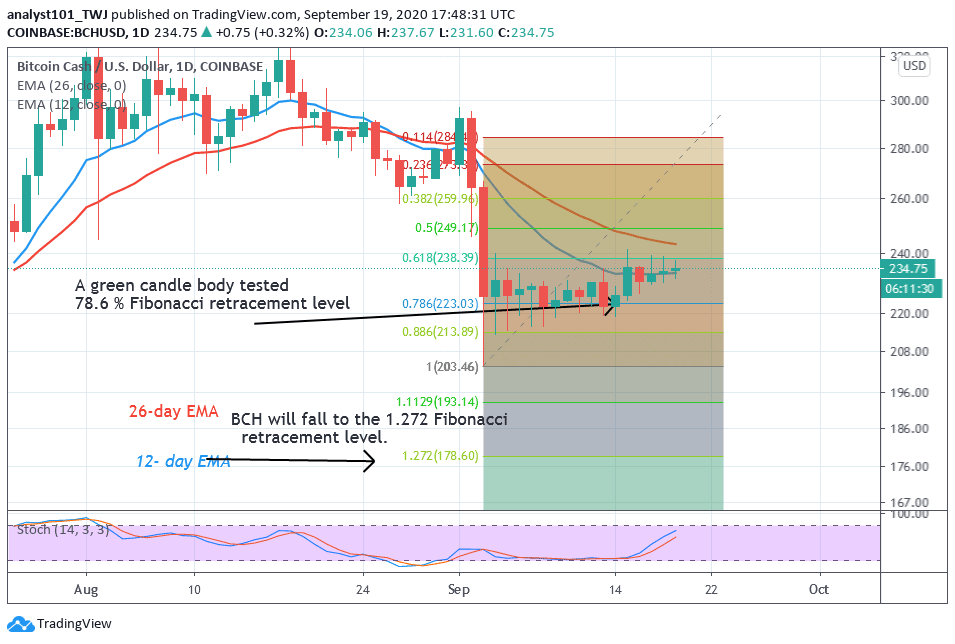
This tight consolidation can easily lead to a breakout or break down. On the upside, if price breaks the $240 resistance, a rally above $260 is expected. The coin will resume upside momentum. On the downside, a break at the $228 support will push the coin to $215 low. However, if the selling pressure persists and breaks below $200 critical support, the Fibonacci tool analysis will hold. On September 3 downtrend, the retraced candle body tested the 78.6 % Fibonacci retracement. It indicates the coin will fall to the low of $177.
Bitcoin Cash Indicator Analysis
The price is below the EMAs which suggests a downward movement of the coin. The price is attempting to break above the EMAs. BCH will resume an upward move if price breaks above the EMAs. The crypto is in a bullish momentum above the 70% range of the daily stochastic.
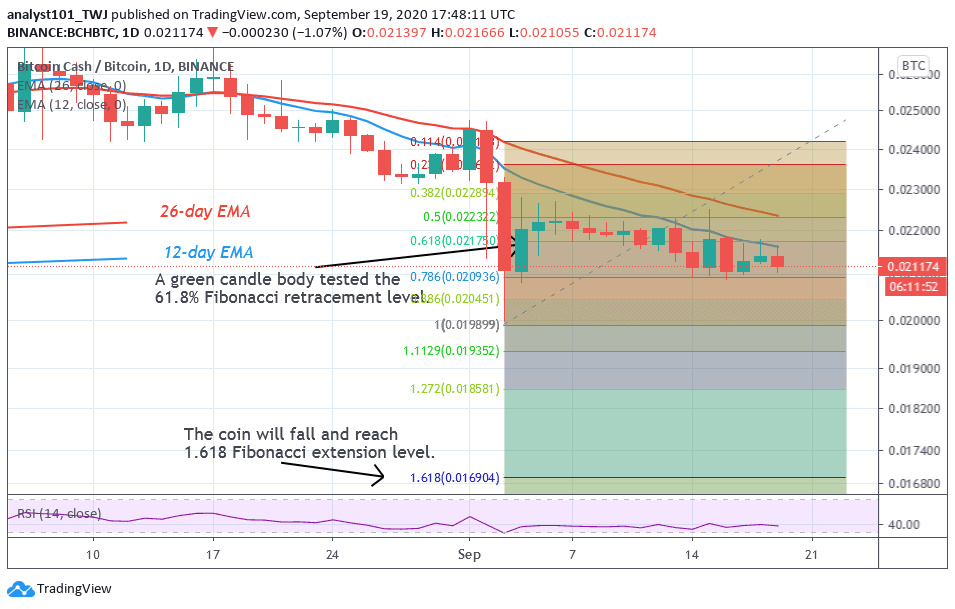
In the BCH/BTC chart, the market is in a downward move. The pair has been a downward move since February. A Fibonacci tool was drawn to determine if the selling pressure is continuing. On September 3 downtrend; the retraced candle body tested the 61.8 % Fibonacci retracement level. It indicates that the coin will further decline. The market will fall and reach the 1.618 extensions level or Ƀ0.016906 low.
Join Our Telegram channel to stay up to date on breaking news coverage