Join Our Telegram channel to stay up to date on breaking news coverage
Bitcoin (BTC) Price Prediction – September 19
Looking at the daily chart, persistent market volatility continues as the Bitcoin price hit the $11,000 mark but the bulls must put more effort to sustain the movement.
BTC/USD Long-term Trend: Ranging (Daily Chart)
Key levels:
Resistance Levels: $11,800, $12,000, $12,200
Support Levels: $10,200, $10,000, $9,800
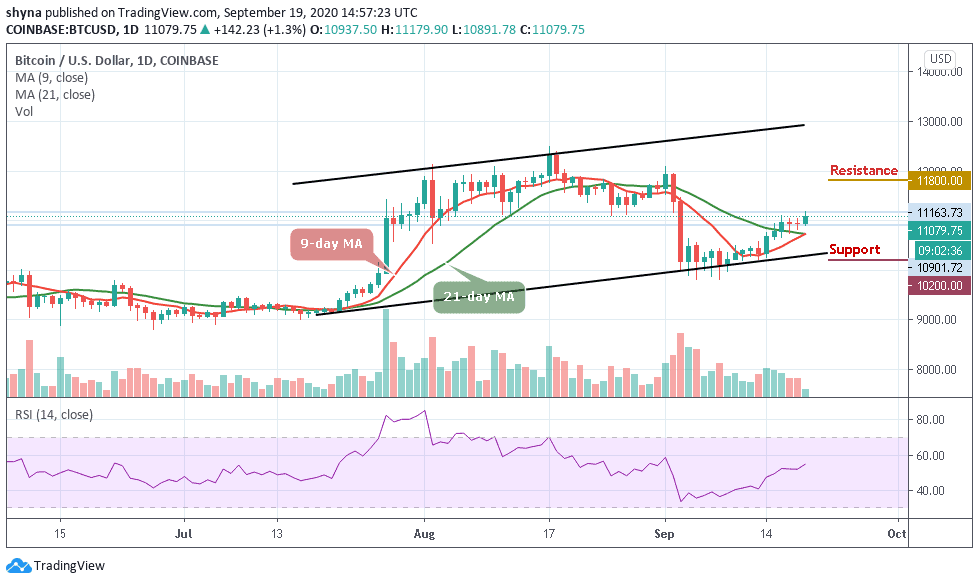
At the time of writing, BTC/USD is up with a 1.3% gain on a daily basis at $11,079. The Bitcoin price remains above the 9-day and 21-day moving averages after touching the daily high at $11,179. However, a daily close above $11,200 may likely open the door for additional gains and the Bitcoin bulls appear to be settling for consolidation before they can forge the rally to $11,500.
What to Expect from Bitcoin (BTC)
The Bitcoin (BTC) is expected to continue the upward movement as the on-going bullish momentum remains intact. If the Bitcoin price holds the resistance level of $11,000 after several pullbacks, the coin may likely grow towards the $11,300 level. Meanwhile, the cryptocurrency has been supported by the 9-day MA. Breaking below this barrier may cause the pair to move towards the lower boundary of the channel.
However, any bullish movement may push the price to the resistance level of $11,800, $12,000, and $12,200 while breaking below the lower boundary of the channel may lead the price towards the $10,500 level. If the support does not hold, the cryptocurrency may further fall towards the support levels of $10,200, $10,000, and $9,800 respectively. The technical indicator RSI (14) is seen moving above the 50-level, suggesting more bullish signals.
BTC/USD Medium-Term Trend: Bullish (4H Chart)
Looking at the 4-hour chart, Bitcoin’s price is currently trading around $11,049, trading above the 9-day and 21-day moving averages after falling from $11,179 where the coin touched today. From a technical point of view, the trend is in the hands of the sellers.
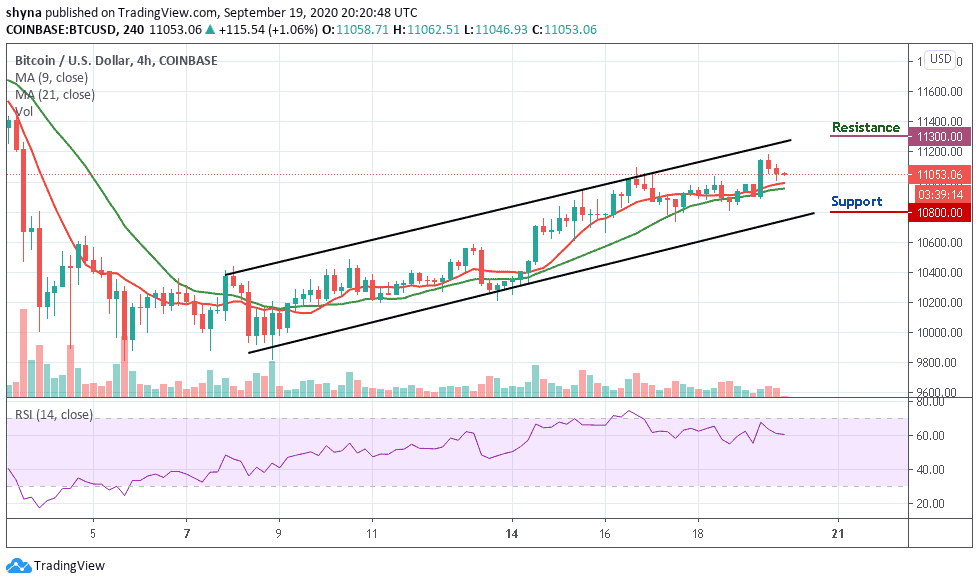
The technical indicator RSI (14) is retreating below 67-level. As long as the downward trend continues, keeping Bitcoin above $11,200 may be a daunting task. In this case, it is best we look at possible support levels, starting at $10,800, $10,600, and $10,400 while the potential resistance lies at $11,300 and above.
Join Our Telegram channel to stay up to date on breaking news coverage