Join Our Telegram channel to stay up to date on breaking news coverage
LTC Price Prediction – September 19
Litecoin (LTC) is dropping with a loss of 0.31% over the past 24 hours of trading as it trades at $48.40.
LTC/USD Market
Key Levels:
Resistance levels: $55, $57, $59
Support levels: $42, $40, $38
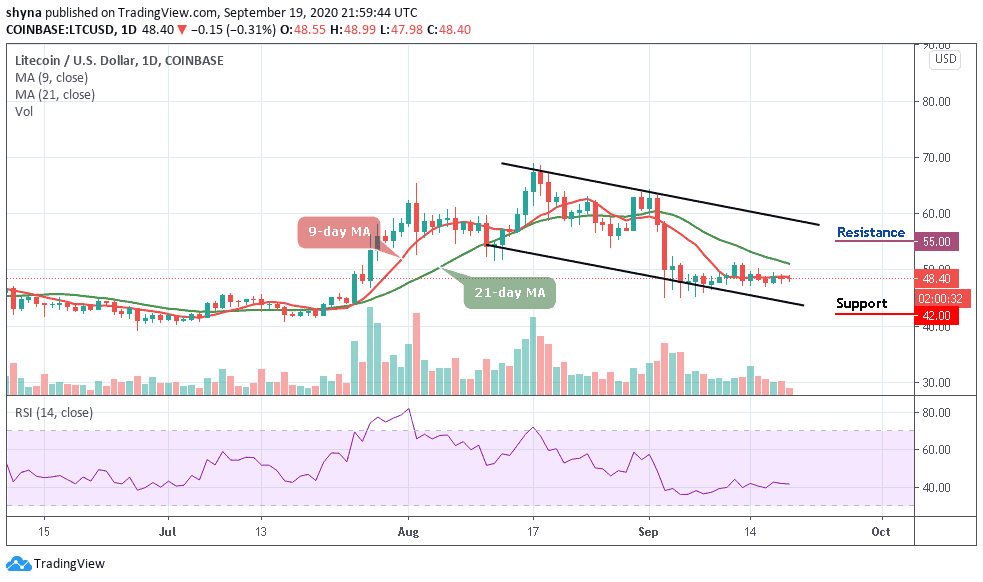
According to the daily chart, LTC/USD is experiencing a 0.31% price drop over the past 24 hours of trading. The cryptocurrency is now trading around the 9-day and 21-day moving averages within the channel. Meanwhile, a break beneath the 9-day MA could see the Litecoin price heading towards the support level of $45.
Where is LTC Price Going Next?
Litecoin is currently trading sideways. It has been struggling below the 50-level over the past 7days of trading. As the coin moves in this range, the market can be considered as neutral at this moment in time. However, the RSI (14) confirms this movement as the signal line moves in the same direction above 40-level. The sellers may continue to increase their momentum which could result in Litecoin falling beneath the $45. If this occurs, Litecoin would be considered bearish.
On the downside, the first level of support lies at $42. This is followed with support at $40 which is expected to prevent the market from falling further. Meanwhile, if the selling continues, traders can expect added support at $38. From the upside, resistance lies at $50 and $52. Above this, potential resistance lies at $55, $57, and $59.
Against Bitcoin, LTC is facing a tremendous fall as the coin recently exploded under the solid support of 4400 SAT and continues to fall towards the 4300 SAT. The critical support level is located below the lower boundary of the channel at 4000 SAT and below.
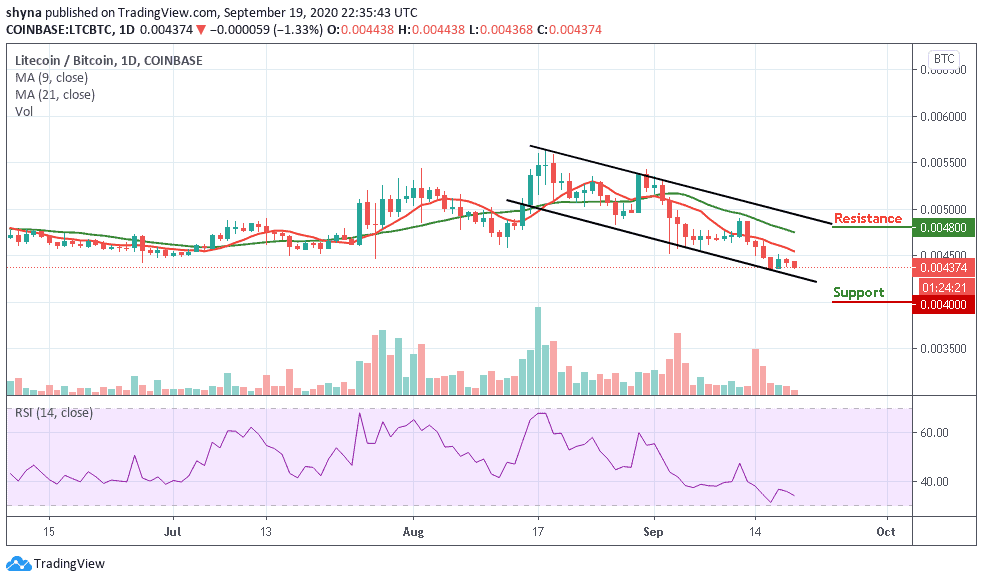
However, any attempt by the bulls to re-power the market could push the coin above the moving averages to find the resistance level at 4800 SAT and above. For now, the RSI (14) is following the downtrend as the signal line moves below 35-level, suggesting more bearish signals.
Join Our Telegram channel to stay up to date on breaking news coverage