

Hi!
Welcome to Small-Cap Monday.
Today is the last day of summer, and it certainly feels like it here in Queens, NY.
As I type these words it’s a brisk 50 degrees, and my neighbor, bless his heart, has got his fireplace going. I can smell the wood smoke in my kitchen.
I have no complaints; it’s a fine aroma, but it does prove that autumn is just a day away. From here on out it’s shorter days and colder nights.
Luckily, we have some profitable bearish trades to keep us warm.
We entered these positions right before the tech wreck of early September… and they’ve provided a nice hedge against a declining market.
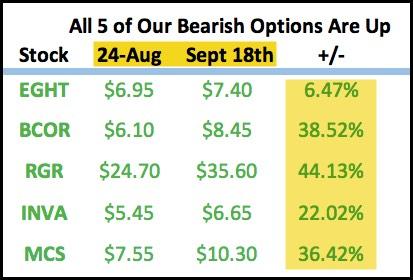
All five Put options are up since August 24. And on an annualized basis, our gains range from +94% (EGHT) to +644% (RGR).
It pays to revise how we found those five trades.
All we did was look for small-cap tickers that…
- Were in weak sectors…
- Were underperforming their sector peers…
- And underperforming the market.
Probability (and market history) did the rest.
Today, we’re going to go the other way. We’re going to get bullish on an ETF that I think will gain momentum from President Donald Trump’s China trade deal.
But first, let’s see what the market’s up to…
Last week, the three large- and mega-cap averages either fell or managed to tread water.

The Dow Jones Industrial Average (up +0.01%) acted as a sort of pivot. It stayed put on the week, rising just a single basis point (one one-hundredth of one percent).
The S&P 500 Index (down -0.64%) and the Nasdaq Composite (down -0.55%) brought up the rear, while our two small-cap proxies shone. The Russell 2000 was up +2.63%, while the S&P 600 was up +1.00%.
Small-caps tend to be riskier investments than larger-cap stocks. So small-cap strength tells us that, even in the face of volatility, investors are in a “risk on” posture.
Can we confirm this posture? We can…
Right now, U.S. Equities is the strongest of the six asset classes. And within that class we find that the broad sectors thought to be risky — Technology and Consumer Cyclicals — are getting the most attention from investors. They’re the strongest.
The broad sectors considered safe — Consumer Non Cyclical and Utilities — are getting the least attention. They’re the weakest.
Our #1 indictor, the New York Stock Exchange Bullish Percent Index (NYSE BPI) showed a bit of strength this past week. Nothing dramatic…

In fact, at first blush, this BPI looks identical to the one from last week’s conversation:

The chart is in a column of Xs… and there are the same number of Xs in the most recent column (highlighted at the far right of the chart).
Can you spot the difference?
The NYSE BPI shows the percentage of stocks trading on the NYSE that are currently on point-and-figure “Buy” signals on their respective price charts.
Last week, that number stood at 56.83 (the purple rectangle at the upper left).
This week? It’s at 57.49.
A little better…
We see a similar “holding pattern” when we look at “Sector Breadth”.
Here’s a snapshot of the market, broken down into 45 sectors. (Image courtesy of Sector Prophets Pro, our Premium data service.)
The blue boxes are sectors controlled by Demand (the bulls)…
Red boxes are sectors controlled by Supply (the bears).

After Friday’s close, the bulls controlled just eight sectors. The remaining 37 were in the hands of the bears.
Here’s the market as of last Friday’s close:

As you can see, the bulls still control just eight sectors.
Supply is still in control, mostly. But over the past week, there’s been no net change in the number of bullish or bearish sectors.
The calendar is about to bring us an Autumn “harvest moon”. So let’s “make hay” with an ETF set to rise on the success of President Donald Trump’s trade deal with China.
On January 15, President Trump and Chinese Vice Premier Liu signed a trade deal. The U.S. would cut tariffs on Chinese goods. In exchange, China agreed to buy more American farm products and manufactured goods.
The so-called “Phase 1” deal has begun to bear fruit.
On September 8, the U.S. Department of Agriculture confirmed that China had purchased 664,000 tons of soybeans.
This represents the biggest daily total since July 22.
Following the announcement, prices for U.S. soybean futures rose to their highest levels since 2018.
Jim Sutter is the CEO of something most investors don’t give much thought to — the U.S. Soybean Export Council.
On September 10, Mr. Sutter told CNBC: “It looks like the outlook demand for the next six months or so is pretty good, so I would say U.S. farmers are feeling much more optimistic than they were a year or even six months ago.”
The Teucrium Soybean (SOYB) ETF looks to track changes in the daily changes of soybean prices.
Prices are measured by the Teucrium Soybean Index.
Basically, this ETF gives investors an easy way to gain exposure to soybean futures.

SOYB has been on a tear lately. On September 8, it put in a bullish “golden cross” as the faster-moving 50-Day moving average crossed above the slower-moving 200-Day.
And as you can see, the recent run higher has been on heavy volume.
Let’s look at the long-term price chart…

The ETF just blew past a key resistance level near $16.00 (the blue arrow). It’s now headed for another historical support/resistance level at $17.00. From there, it has a clear path to $18.00.
So we could see a quick 11% move by mid- to late-October.
SOYB is overbought right now. So this isn’t a risk-free play by any means. But we can gain exposure to the fund by purchasing the February 2021 14 Strike Call Option.
Right now, the mean bid/ask price for this option is $2.50. So, for $250, you can control 100 shares of the fund.
Have a great week!
Bill Spencer
Editor-in-Chief, True Market Insiders
Want More Great Investing Ideas?
Free Report: The Right Investment At The Perfect Time
The Shocking Truth Why You Don’t Make More Money In Stocks
SOYB shares were trading at $15.92 per share on Monday morning, down $0.25 (-1.55%). Year-to-date, SOYB has gained 0.57%, versus a 1.17% rise in the benchmark S&P 500 index during the same period.
About the Author: Bill C. Spencer

Since 2016, Bill Spencer has served as Editor-in-Chief at True Market Insiders. He also runs two of their Premium trading services -- Founder’s Forecast which has a longer-term focus and Swing Tech Trader which plays the cutting edge of technology for fast profits. More...
More Resources for the Stocks in this Article
| Ticker | POWR Rating | Industry Rank | Rank in Industry |
| SOYB | Get Rating | Get Rating | Get Rating |
| EGHT | Get Rating | Get Rating | Get Rating |
| RGR | Get Rating | Get Rating | Get Rating |


