Join Our Telegram channel to stay up to date on breaking news coverage
XRP Price Prediction – September 21
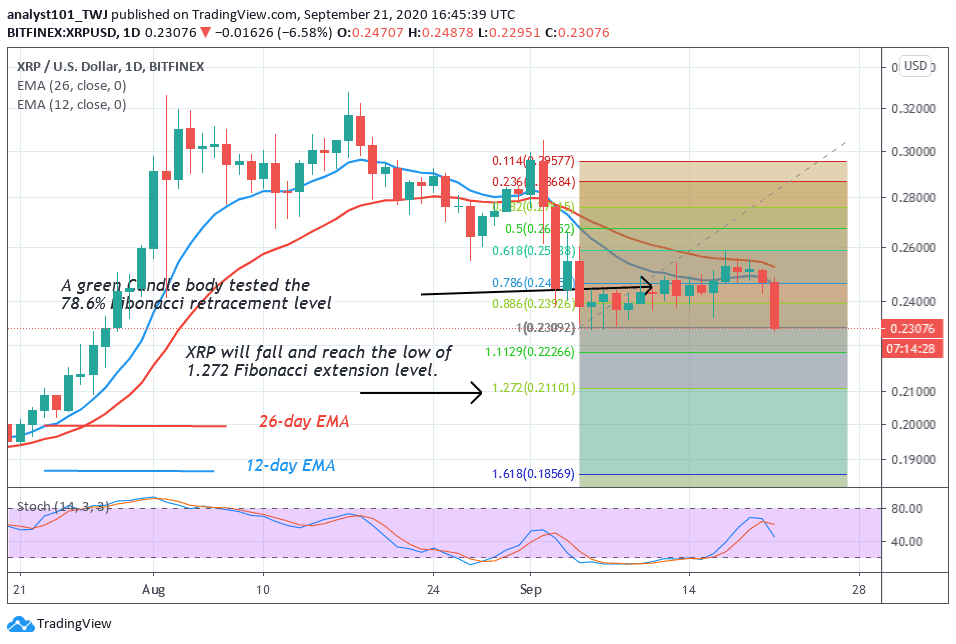
Currently, the Ripple price is following a downward movement, trading below the $0.230 resistance level.
XRP/USD Market
Key Levels:
Resistance levels: $0.270, $0.280, $0.290
Support levels: $0.200, $0.195, $0.190

XRP/USD price is slowly declining below the key supports as the price might revisit the $0.200 support before it could start a new increase. However, after struggling to stay above $0.250, XRP/USD started a slow and steady decline. The coin is seen trading below the key $0.240 support level to move into a short term bearish zone.
What is the Next Direction for Ripple?
XRP/USD is currently changing hands at $0.230 and as the coin is already trading below the 9-day and 21-day moving averages, any attempt to make it close below the lower boundary of the channel, this may open the doors for more downsides. However, traders should keep eye on the $0.210 and $0.205 before creating a new low at the support levels of $0.200, $0.195, and $0.190.
In other words, we may experience a quick buy once the trade reaches the support at $0.220. For a retracement move, the $0.240 level is likely to resurface before the rally continues. If the $0.240 could now contain the retracement, the price may further swing to $0.270, $0.280, and $0.290 resistance levels. The RSI (14) is moving below 40-level, indicating an oversold phase.
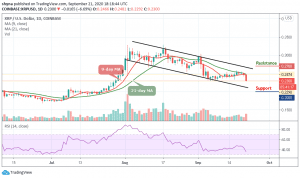
Against Bitcoin, the situation is becoming bleak as the market keeps trading below the 9-day and 21-day moving averages. The XRP/BTC couldn’t break above this barrier, causing a drop down to 2208 SAT. The market opens today with a downward trend and now trading at 2219 SAT at the time of writing.

From the upside, the nearest level of resistance lies above the upper boundary of the channel, if the bulls can break above this barrier, further resistance may be found at 2400 SAT and 2500 SAT but if the sellers continue to push the price beneath the current price at 2219 SAT, the next level of support is located at 2050 SAT and below. The RSI (14) has crossed below 35-level as the bears gain control of the market.
Join Our Telegram channel to stay up to date on breaking news coverage