
Crypto Chartbook: Bitcoin – Out Of This World
The core concept of space exploration is natural risk-seeking, welcoming the risk by controlling it, and searching for expansion. Similar to Bitcoin investing. That is to say, the instrument you might have searched for to expand on your wealth preservation. And just like in space, counterintuitive behavior is necessary for an environment that requires a special mindset. Bitcoin – out of this world.
We are not all trained astronauts but impersonating an existing character like a superhero can be a useful trick. Spock in Star Trek is not from this world. As such not bound to typical laws as we would normally solve a conflict situation as humans with instinct, devastating if done in trading. The reason why novices do not have a random hit rate but are consistent losers is that they trade in stress situations from an intuitive mind perspective and as such make consistently the wrong decision.
With a Spock impersonation, one would be logical with slight suppression of emotions, a large degree of curiosity towards everything, and a high level of discipline in behavior. His analytical and humble persona suits a successful traders’ path. In other words, the ideal makeup for solid trade execution.
BTC-USDT, Monthly Chart, Bitcoin – out of this world:
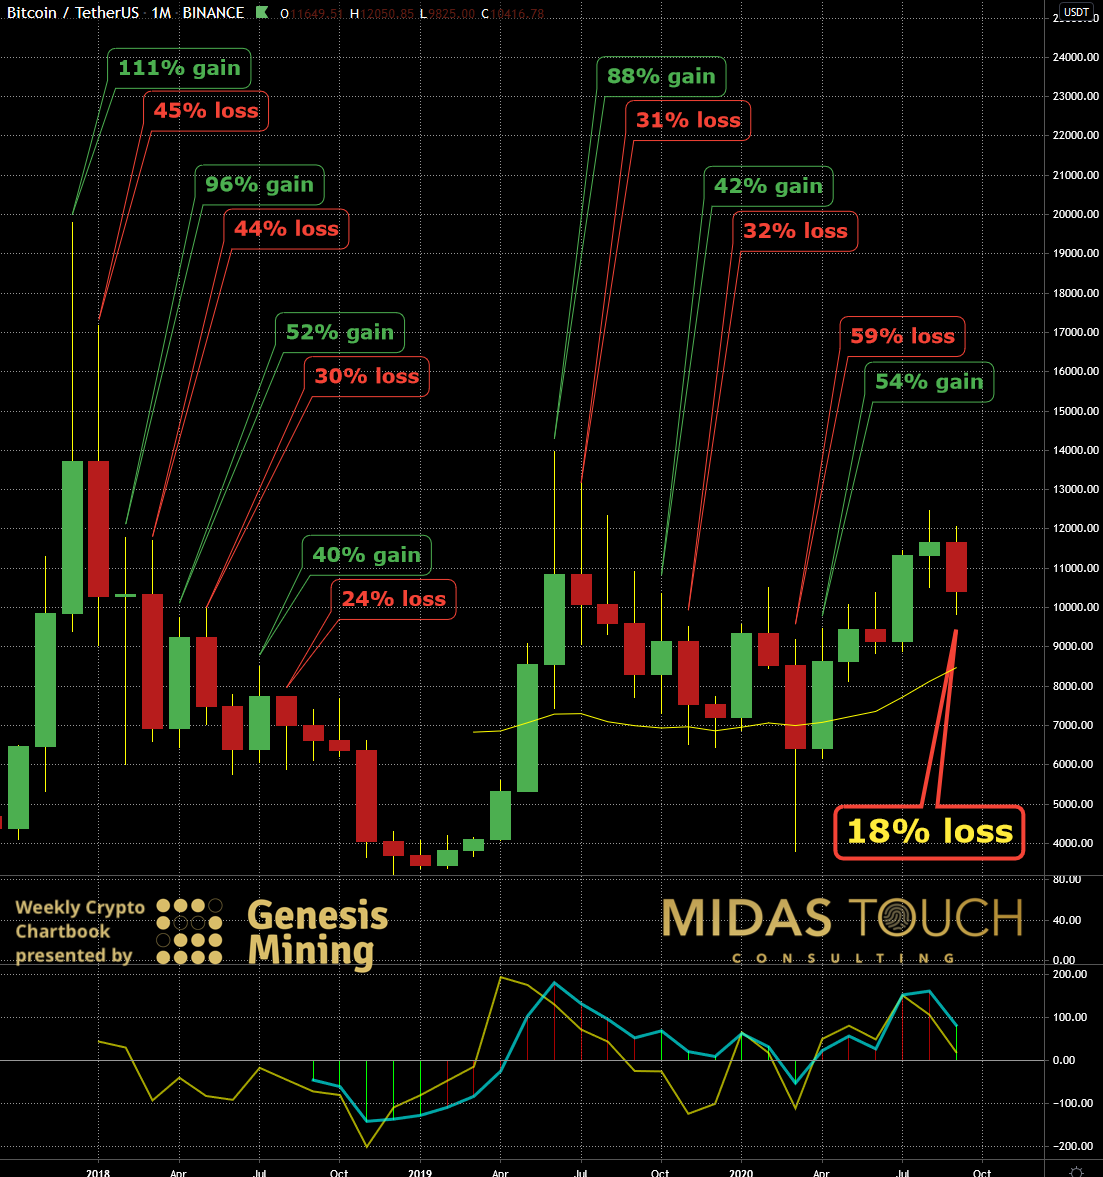
BTC-USDT, monthly chart as of September 22nd, 2020
One look at the monthly chart gives you a clear indication that Bitcoin isn’t your classical trading instrument. While typically one can avoid volatility stepping towards a higher time frame, even the long-term investor needs special skills here to manage the swings. We have marked out monthly pairs and measured their percentage gains and losses from their absolute highs and lows of the month. None of these retracements is acceptable for any time horizon and can possibly wipe your account. At the very least the risk is extremely high to have damaging downswings in your performance curve. Typically, professionals would avoid instruments with such added risk. However, in this case with the limited options left for a balanced wealth preservation portfolio, skipping Bitcoin is a mistake. Instead, an alter ego might be just a necessary tool to find the needed confidence to trade such volatility properly.
The monthly chart seems to be in the process to be building a cup and handle formation since mid of last year. The cup is finished and the handle is about to be shaping up.
BTC-USDT, Weekly Chart, Anything goes:
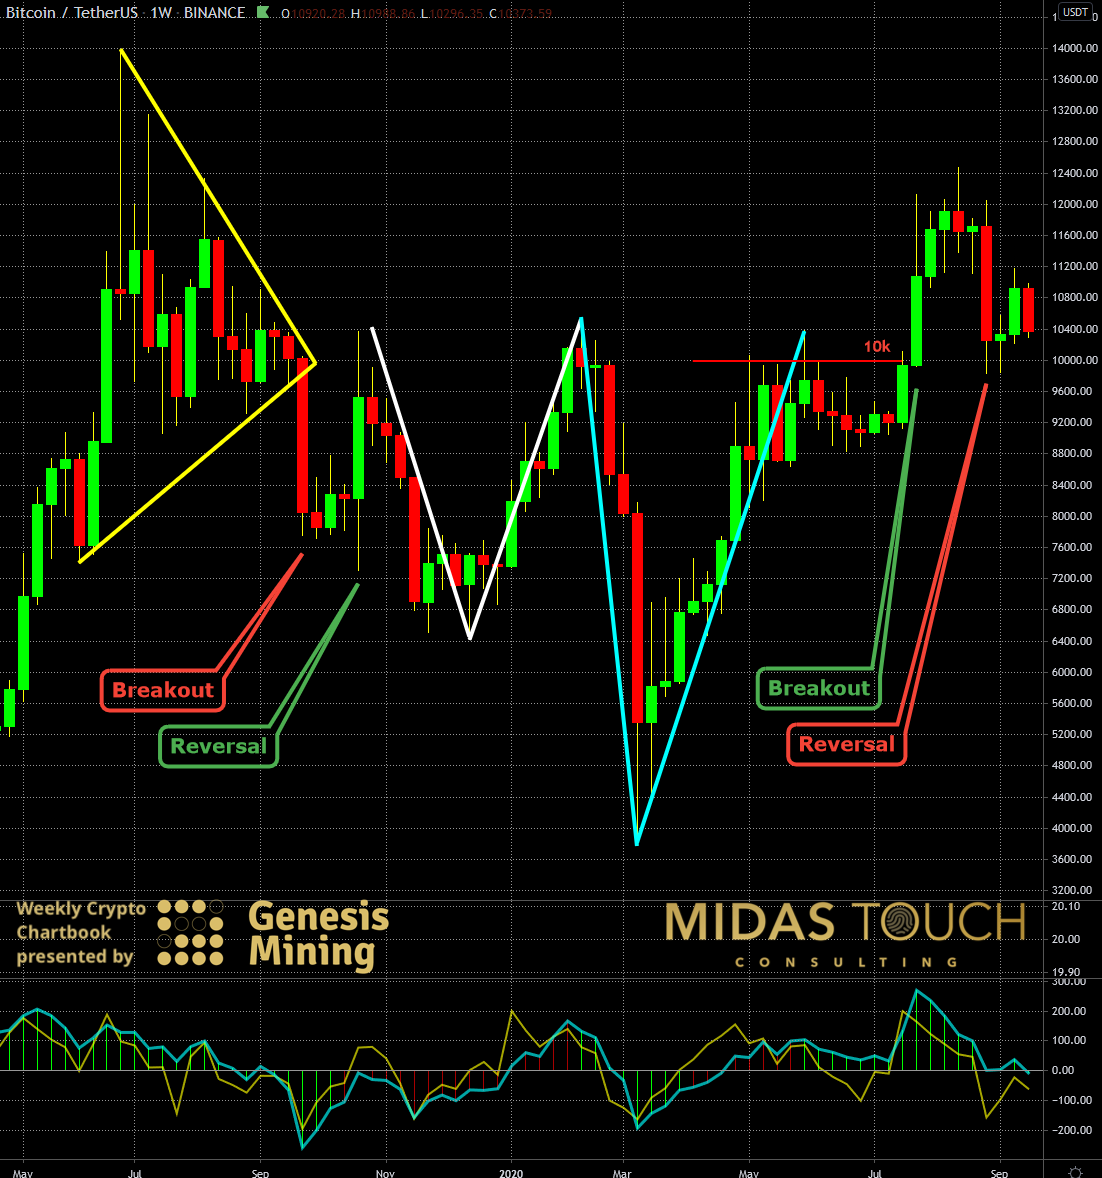
BTC-USDT, weekly chart as of September 22nd, 2020
The weekly time frame is showing no fewer challenges even for the professional market participant. Examining the last two years, we see in yellow a highly volatile wide range triangle congestion zone. Once it breaks to the downside it shortly after reverses by more than 100 percent. Quickly prices decline again (white lines) to build a “V” formation reversal. Again prices plummet, and again another sharp “V” reversal. Even the 10k breakout is followed by a more than 100 percent reversal. All exotics are thrown at you as a trader and looking closer you will find each time old highs and lows taken out to just capture stops.
But we are not saying this is not trade-able. Our statistics over the last 32 months posting trades in real-time in our free telegram channel proofs that it is. Nevertheless, strong confidence is needed to engage in a trading vehicle like this.
We find the weekly time frame to be showing a bullish sentiment and are confident for higher prices to come in the near future.
BTC-USDT, Daily Chart, Confidence needed:
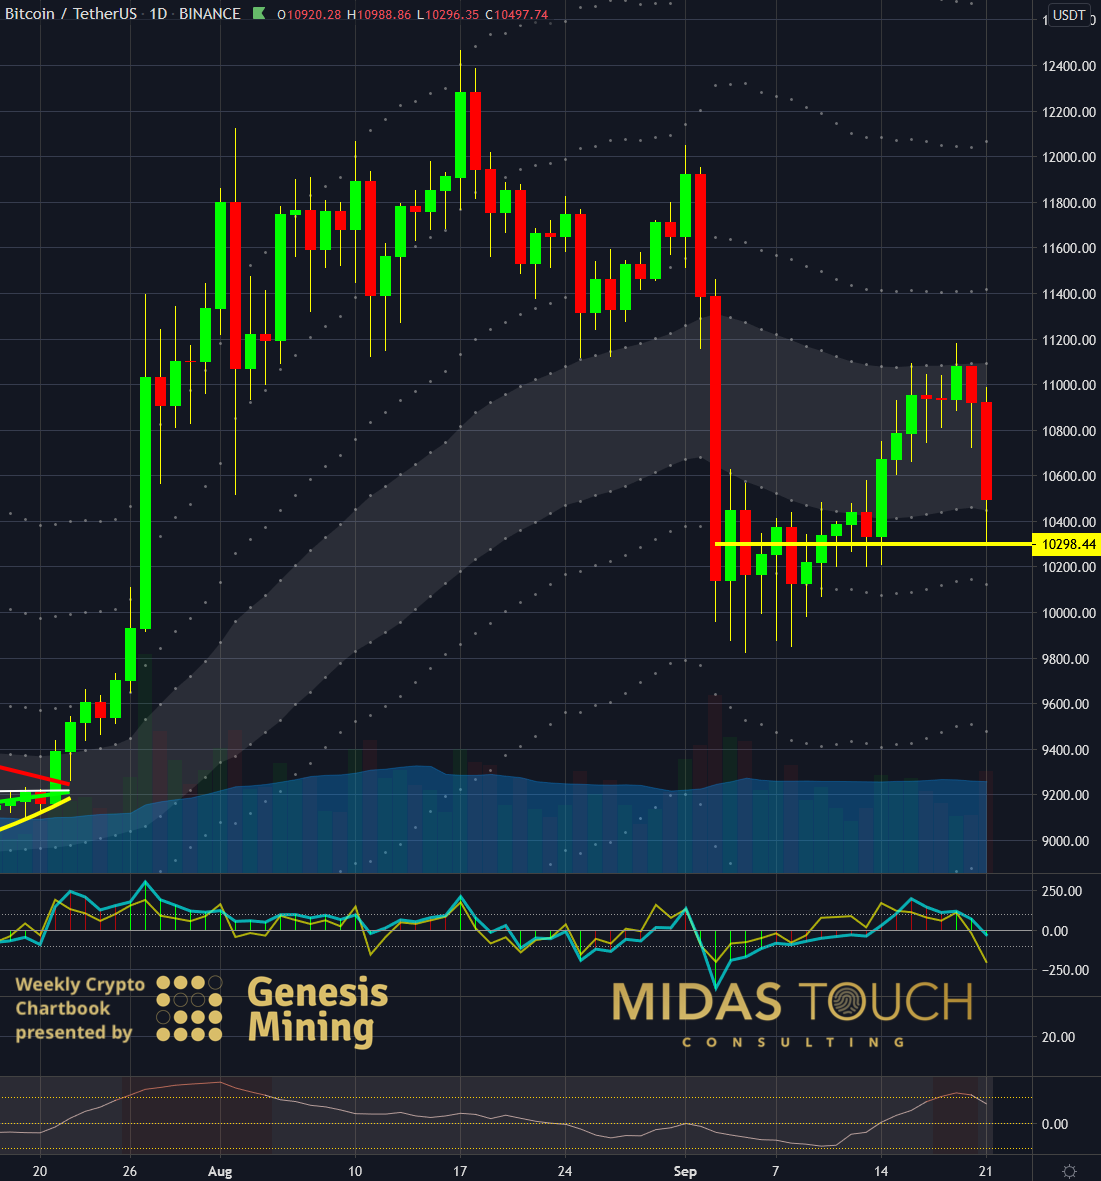
BTC-USDT, daily chart as of September 22nd, 2020
Dropping down another time frame to the daily chart confirms the picture. Without adequate money management and good exit tools (see our quad strategy), it would be difficult to be consistently profitable. Where warning signs are quickly identifiable is when candlestick charts have consistently long wicks on their candles. We see this on all time frame charts of Bitcoin but especially on the daily time frame. No matter if Bitcoin is trading upwards, sideways, or downwards, you can find this telltale continuously.
The daily time frame, even with a mere 6% intraday range of a strong decline on Monday the 21st of September, might provide low-risk long entries by mid-week. Depending on further development, this entry might then be transferred to the weekly time frame.
Bitcoin – out of this world:
Using role play like this and getting in character before execution is a great way to overcome certain personal mental makeup shortcomings that aren’t useful to trading. You might be able with this little trick of pretending to be Vulcan to overcome fear or running stops, getting out too early, and violating rules you set for yourself as a whole. Detaching one from one’s makeup and pretending to be a superhuman is one way to improve one’s execution skills in trading and an easy enough method to try to circumvent constant self-sabotage in one’s trading behavior.
Spock stood for searching for the truth and figuring out how things work. He was an outsider and a loner with problems of fitting in. Attributes that quite a few traders share. That is to say he is just one example though, and any superhero image will do to “fake it until you make it”.
Disclosure: None.


