
Is Gold About to Move Higher?
By:
Gold prices are being influenced by a number of different contradictory factors, some traditionally good for bullion, others not.

This latest bout of dollar weakness can be thought of as positive for the yellow metal, whereas the recent gains in US equities have been hinting at a possible, though tentative, return to “risk-on” which ought to be weighing on gold prices. Speculation as to a possible COVID-19 vaccine has certainly lifted animal spirits, which could be negative for gold prices. An effective vaccine would not only be good news for the pharmaceutical industry, but also for the global economy as a whole. It could be the first step to a possible return to normality for all manner of businesses that have been hit hard by the pandemic and resultant lockdown measures.
But then, we also have the looming US presidential election and all the uncertainty surrounding it. It would seem that the United States is caught between the political rock and hard place of Trump and Biden, both being candidates that vast swathes of the US populace have strong reasons for not wanting as their commander-in-chief. Many are expecting further upheavals following the election, particularly if Trump ends up being victorious. Add to this the surges in European COVID-19 cases as the virus begins to rear its ugly head again in places like France and Spain, and you can understand why this quintessential safe-haven asset seems to be pulling in different directions.
A look at the technicals
Monday the 14th, saw gold futures climbing to book their largest increase for the month. Gold appeared to be forming a symmetrical triangle after the precious metal broke through the fabled $2000 level in early August and then promptly retraced all the way back down to $1862. Keep in mind that in contrast with descending triangles, which have a downward bias, and ascending triangles, which have an upward bias, symmetrical triangles have no bias at all. This means that the price is just as likely to break bullish as it is to break bearish. Evidently the technicals are also reflecting the general state of uncertainty that markets seem to be characterised by of late.
As you can see in the chart below, gold’s recent surge to new highs appeared to be running out of steam as market participants took profits and the price action cooled following a 14-day run that saw the price climbing from just under $1800 on July 17, to an all-time-high $2075 on August 6. This cool-off was anticipated by the RSI divergence we saw on the last leg of gold’s most recent surge higher. When RSI levels diverge from price action (in this case forming a lower-high as the price action forms a higher-high), it is an indication that the rally is possibly running out of steam.
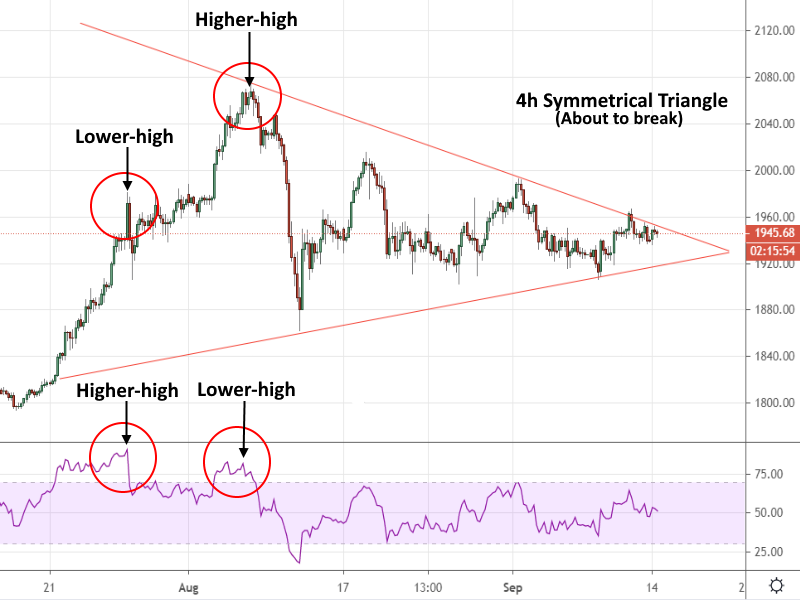
Why is the above interesting? Because of just how overbought gold recently was. Had this most recent high been the peak of gold’s move up, you would have expected a more pronounced sell-off, possibly followed by the formation of a descending triangle as each subsequent bounce fails to break the previous high. Instead, what we’ve seen is a consolidation pattern that seems to be suggesting a further build-up of pent-up energy and a possible move higher. Another thing to be aware of is that this recent break of the $2000 level wasn’t just a huge psychological milestone; it was also momentous from a technical standpoint.
Again, if we look at the RSI levels we can observe that the last time gold’s RSI was so overbought on the daily chart was way back in September of 1999 (see below). That’s when gold rallied from $253 to $338 in less than a month as the dot-com bubble approached its height.
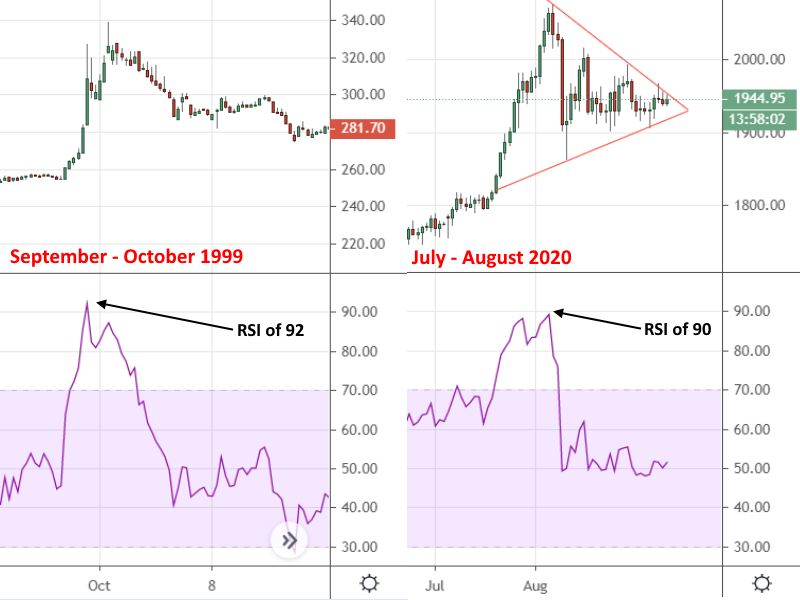
Far from being a local top, the rally gold experienced back in 1999 was just the beginning of an extended bull market that would see it rising steadily until its $1900 peak back in 2011, following the Global Financial Crisis. That’s not to say that we’re bound to see a repeat performance, however, there are similarities. Many believe that gold has to be repriced to reflect the unprecedented monetary expansion we’ve seen in recent years, as well as the general inflation of other assets, from stocks and property, all the way to market newcomers such as cryptocurrencies.
To buy or not to buy?
This remains the question on everyone’s lips. On the one hand, gold has already performed so well since 2018, suggesting that a more pronounced pullback may be in store. On the other, the factors supporting gold prices have only been increasing as outlined above. Long-term, there’s a lot to suggest that even at these levels gold could be a solid investment. Short-term, it’s anyone’s guess. However, as far as the recent price action is concerned, we’ve seen a successful retest of the $1800 level, consolidation, and as you will see below, a bullish break of that aforementioned symmetrical triangle. All of which are strong bullish signals.
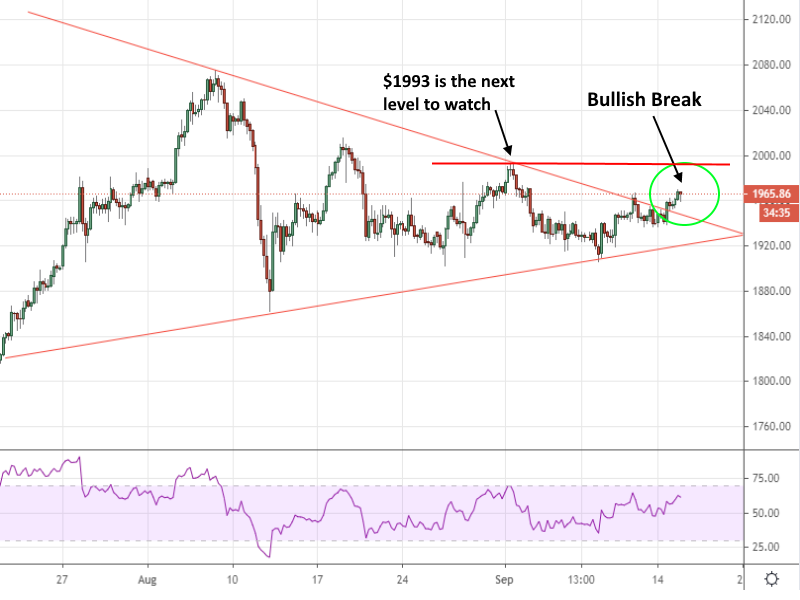
Keep in mind that triangles are just a guide, and they can be highly vulnerable to fakeouts. The price can break out of a triangle for several candles, only to reverse course and carry on moving in the opposite direction. What we need now, in order for the bull case to be confirmed on the shorter timeframes, is a break above $1993. This is the last lower-high gold set on the 4-hour chart. After that, the next price level to watch is $2015, and finally the recent all-time-high of $2074.
By Giles Coghlan, Chief Currency Analyst, HYCM
About HYCM
HYCM is the global brand name of Henyep Capital Markets (UK) Limited, HYCM (Europe) Ltd, Henyep Capital Markets (DIFC) Ltd and HYCM Ltd, all individual entities under Henyep Capital Markets Group, a global corporation founded in 1977, operating in Asia, Europe, and the Middle East.
High Risk Investment Warning: Contracts for Difference (‘CFDs’) are complex financial products that are traded on margin. Trading CFDs carries a high degree of risk. It is possible to lose all your capital. These products may not be suitable for everyone and you should ensure that you understand the risks involved. Seek independent expert advice if necessary and speculate only with funds that you can afford to lose. Please think carefully whether such trading suits you, taking into consideration all the relevant circumstances as well as your personal resources. We do not recommend clients posting their entire account balance to meet margin requirements. Clients can minimise their level of exposure by requesting a change in leverage limit. For more information please refer to HYCM’s Risk Disclosure.
About the Author
Giles Coghlancontributor
Giles Coghlan is a Chief Currency Analyst and has been consulting for HYCM Group since April 2018. Giles plays a key role by internationally representing the Group and providing his expertise to HYCM’s investors.
Did you find this article useful?
Latest news and analysis


Advertisement