
Crude Oil And Gold Prices Eyeing Pelosi-Mnuchin Meeting On Stimulus
Sentiment-linked crude oil prices aimed cautiously higher over the past 24 hours as the commodity benefited from a rosy session for global equities. The S&P 500 climbed for a third consecutive day as volatility cooled. Anti-fiat gold prices climbed 1.11 percent in the best performance over the course of 24 hours in one month. Weakness in the haven-linked US Dollar seemed to offer a boost to the precious metal.
Futures tracking US benchmark stock indices climbed cautiously during Tuesday’s Asia Pacific trading session, perhaps hinting at an upbeat day ahead. Lately, hopes of additional US fiscal stimulus have been driving the rosy tone in traders. Nancy Pelosi, Speak of the US House of Representatives, will talk with Treasury Secretary Steven Mnuchin 20:30 GMT.
There remains a roughly $1 trillion gap between what Democrats have proposed and what Republicans could be looking for. Should talks fall apart, sentiment risks unwinding. Otherwise, crude oil prices may continue benefiting from the ‘risk-on’ tone. Keep a close eye on the API weekly oil inventory report. A third consecutive week of diminishing supply could also work to support WTI.
Further weakness in the US Dollar may also offer XAU/USD a boost over the next 24 hours. Gold may see volatility around the Conference Board Consumer Confidence. A rise to 90 from 84.8 is expected. While data out of the US continues to outperform to economists’ expectations, the margin of surprise has been fading since July. This may open the door to slight disappointment.
Crude oil technical analysis
WTI crude oil prices continue trading within a Symmetrical Triangle, a fairly neutral chart pattern. The direction of the outbreak may project oil’s path ahead given confirmation. In the event of a turn lower, keep a close eye on the 36.15 – 37.10 support zone. Should price rise instead, the 42.91 – 43.87 resistance range could keep prices at bay.
WTI Crude oil daily chart
(Click on image to enlarge)
Chart Created Using TradingView
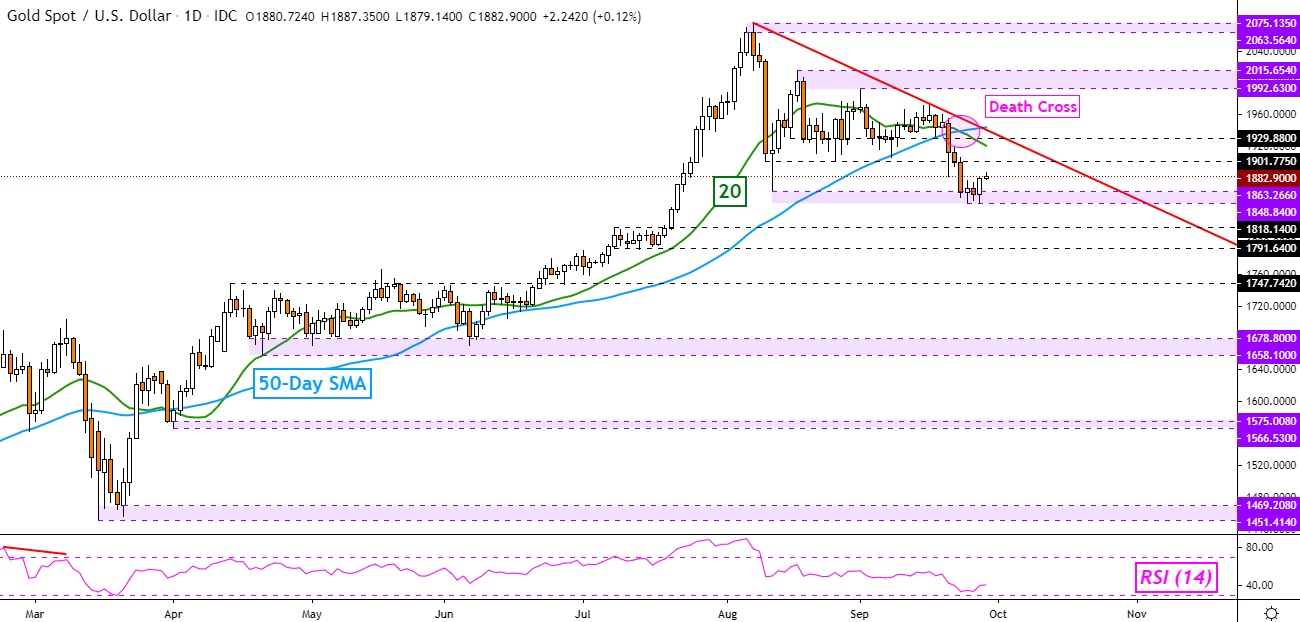
Gold technical analysis
Gold prices bounced off the 1848 – 1863 support zone following a drop under 1901 on the daily chart below. While there me room for near-term gains, the 20-day and 50-day simple moving averages recently formed a bearish ‘Death Cross’. This could reinstate the focus to the downside down the road. Another item to watch for is the potential falling trendline from August 7th. A third testing point could confirm it.
XAU/USD Daily chart
(Click on image to enlarge)
Disclosure: See the full disclosure for DailyFX here.


