Join Our Telegram channel to stay up to date on breaking news coverage
LTC Price Prediction – October 10
At the time of writing, the Litecoin (LTC) has is gaining over 3% in the recent 24 hours to trade at $50.48.
LTC/USD Market
Key Levels:
Resistance levels: $54, $56, $58
Support levels: $44, $42, $40

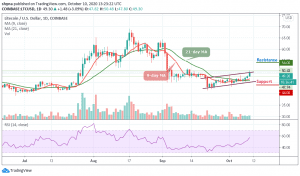
LTC/USD bulls are taking charge of the market since the early hours of today. A sustainable move above the upper boundary of the channel at $50 increases the upside momentum and allowed the coin to hit a daily high of $50.48, which is the highest level since the beginning of this month. Before this day, LTC/USD has been trading below the moving averages. The coin is now making an attempt to settle in the upper part of the channel.
What to Expect from Litecoin (LTC)
In the early hours of today, LTC/USD has gone up from $47.82 to $50.48 as the bulls are taking charge. Meanwhile, if the bulls retain control of the market, they should be able to push the Litecoin price above the $52 level. The daily technical indicator is also showing a strong resistance level of $50-zone. On the downside, we have one healthy support level at $46, which has the 21-day moving average.
Moreover, the nearest resistance is located around $52 but the bulls fail to hit this level, the sell-off from this resistance may result in a massive long squeeze and which may likely push the price to the nearest support of $45. Once it is broken, the sell-off may be extended towards the supports of $44, $42, and $40 respectively. However, as the technical indicator struggles to cross above the 60-level, the next resistance levels may be located at $54, $52, and $50.
Against Bitcoin, the LTC price is making an attempt to cross the upper boundary of the channel in other to reach the resistance at 4500 SAT. Unless this resistance is effectively exceeded and the price ends up closing above it, there might not be any reason to expect the long-term bullish reversal.

However, trading below the moving averages could refresh another low under 4300 SAT and a possible bearish continuation may likely meet the major support at 4200 SAT before falling to 4150 SAT and below while the buyers may push the coin towards the potential resistance at 4600 SAT and above as the RSI (14) moves toward the north, suggesting more bullish signals.
Join Our Telegram channel to stay up to date on breaking news coverage