Join Our Telegram channel to stay up to date on breaking news coverage
LTC Price Prediction – October 18
Since a few days ago, Litecoin (LTC) has been experiencing a downtrend within the channel.
LTC/USD Market
Key Levels:
Resistance levels: $51, $53, $55
Support levels: $44, $42, $40
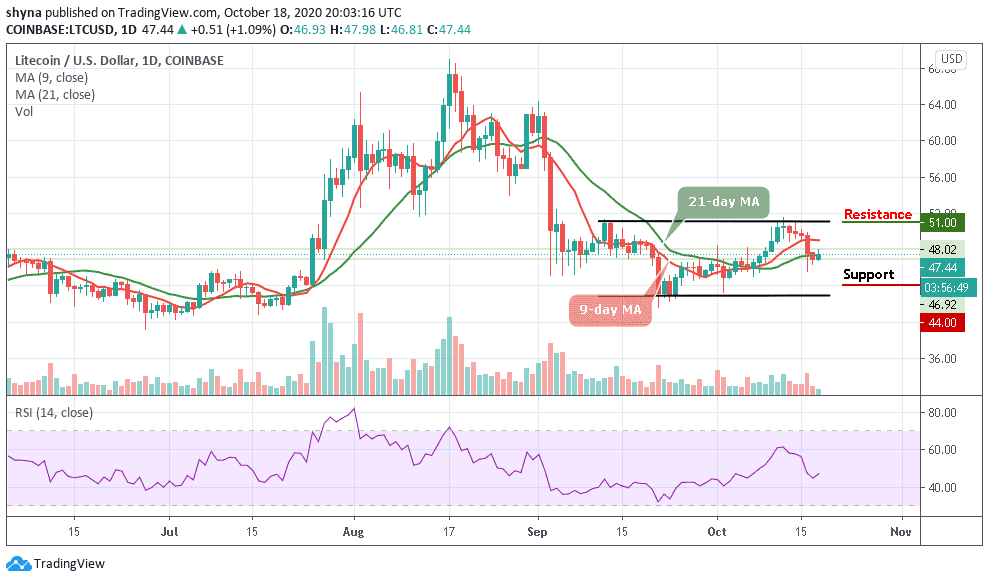
LTC/USD is gaining around 1.09% in the recent 24 hours to trade at $47.44 at the time of writing. The coin has been one of the best-performing coins out of top-10 today as the upside momentum has been gaining traction since the early hours of today. However, LTC/USD dipped to the psychological $45.64 a couple of days ago before the recovery resumed today.
What to Expect from Litecoin (LTC)
The market price is currently displaying a sign of subduing volatility, ready to cross above the 9-day and 21-day moving averages. Meanwhile, taking a look at the daily chart, we can see that the trading volume is coming up slowly while the technical indicator RSI (14) moves above the 45-level, suggesting more bullish signals.
Meanwhile, if the Litecoin price remains above the control of the bulls, it may likely roll to the nearest resistance at $51, $53, and $55 levels. On the downside, any bearish movement below the moving averages within the channel could bring the market price to the support level of $44, $42, and $40 respectively.
Against Bitcoin, LTC continues to trend below the 9-day and 21-day moving averages. In case of a trend reversal, there is a need for an increasing volume and resistance to cause an upsurge in the market. Now, the coin is trading around the 4133 SAT, traders can expect close support below the lower boundary of the channel at 4600 SAT and below.
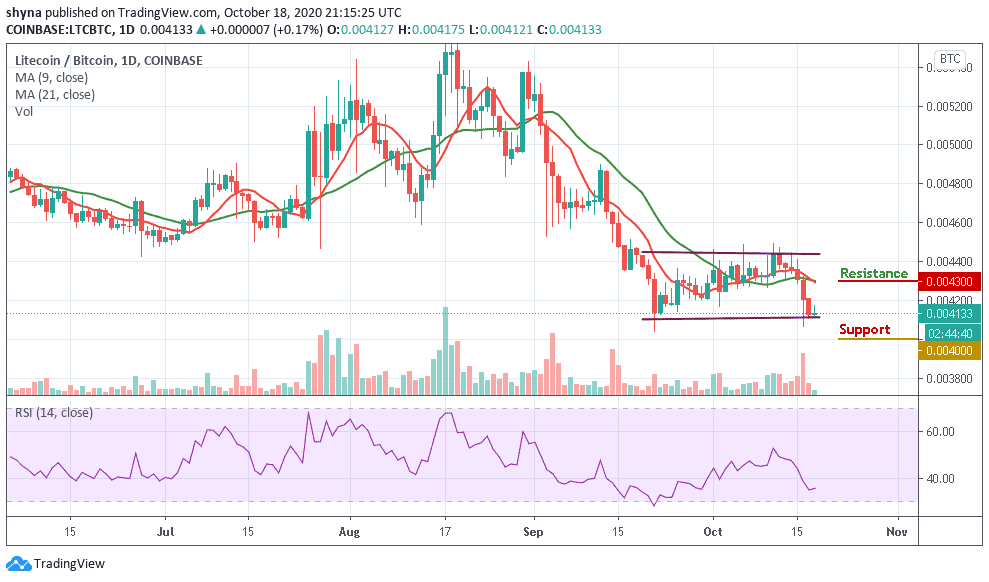
Meanwhile, there’s a sign of a bullish movement in the market at the early hours of today’s trading. Therefore, if a bullish movement continues and validates a break above the moving averages; traders can then confirm a bull-run for the pair and the closest resistance may be located at 4300 SAT and above. On the contrary, the technical indicator RSI (14) is seen moving below 40-level, suggesting more bearish signals.
Join Our Telegram channel to stay up to date on breaking news coverage