
Gold Price Forecast: XAU Bulls Tempt Breakout - But Can They Drive?
Gold prices have been in digestion mode for two-and-a-half months now. It might be hard to believe if we go back to early-August when Gold prices were showing hints of a mania on their way up to fresh all-time-highs. Perhaps what was most remarkable about that move was just how incredibly one-sided it was from late-June and through July. Gold prices took out a number of key resistance levels along the way, but this was a pretty clear example of a trending state in a cyclical market.
That fresh all-time-high soon showed a bearish signal on August 7th. As written in the Gold Technical Forecast for that week, the Friday bar responding to that fresh all-time-high closed as a bearish engulfing pattern; and then the next week brought on a retracement of more than $200 as bulls bailed and prices tried to equalize.
GOLD PRICE DAILY CHART
(Click on image to enlarge)
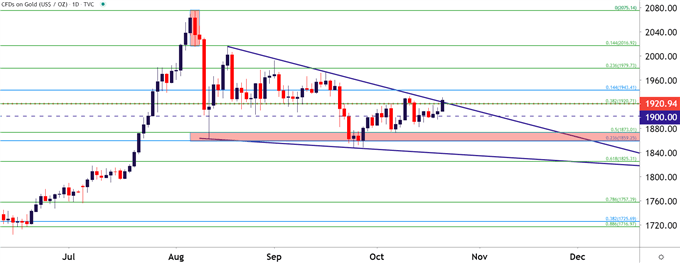
Chart prepared by James Stanley; Gold on Tradingview
That retracement found a bit of support at a confluent spot on the chart but, bulls weren’t yet ready to continue the move. As a matter of fact, we still might be in that spot where bulls aren’t yet ready to continue as the past two-and-a-half months have brought on a continued case of digestion in Gold prices.
This digestion has taken on the form of a falling wedge pattern; and given the context, that falling wedge is taking on similar tonalities as a bull flag formation. Falling wedges and bull flags will both often be approached with a bullish aim, looking for buyers to re-take control after digestion of a recent and fresh high.
This also wouldn’t be the first time that Gold prices have went on an extended bout of digestion in this recent bullish cycle: Similar instances happened in February-May of last year; and then again from September-December of last year. Each of those digestion themes took months to reconcile; with bulls eventually winning-out and continuing to drive the topside theme.
GOLD PRICE WEEKLY CHART: MONTHS LONG DIGESTION IN FALLING WEDGES
(Click on image to enlarge)
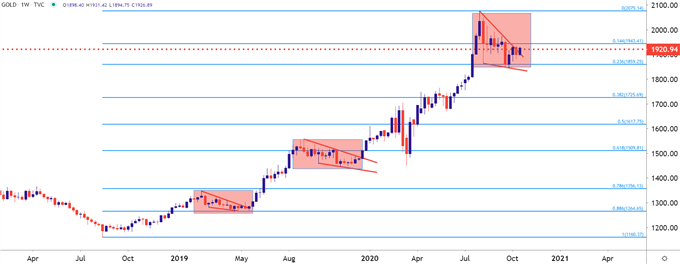
Chart prepared by James Stanley; Gold on Tradingview
The big question at this point is whether bulls are taking the reigns again. Price action is testing above the resistance trendline making up the falling wedge formation, and prices are currently holding above a very key price on the chart at 1920. That level was the all-time-high for more than seven years before being taken out by a surging trend in the month of July. It has since caught multiple resistance inflections as this digestion has continued and, may eventually be repurposed for higher-low support when buyers do eventually re-take control of the matter.
At this point, the line in the sand of interest appears to be around 1933, which is the current monthly high. A breach above that exposes a Fibonacci level at 1943.41, and a test there opens the door for higher-low support around the 1920 level.
Gold bulls should continue to exercise caution, however, until that new monthly high comes into play. A similar situation presented itself a couple of weeks ago – with bulls bursting above 1920 only for prices to fall back into the prior range.
GOLD PRICE FOUR-HOUR CHART
(Click on image to enlarge)
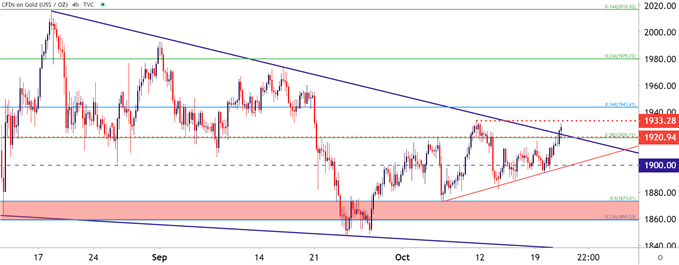
Chart prepared by James Stanley; Gold on Tradingview
Disclosure: See the full disclosure for DailyFX here.


