

- The market expected a 52 bcf injection into storage for the week ending on October 16, 2020
- Record supplies are on the horizon going into the winter months
- The price rose to another new high this week- How long can that last?
With October winding down, the natural gas market in the US is at an inflection point. It will not be too long before the 2020 injection season ends, and the energy commodity begins flowing out of storage at a faster rate than it flows into storage facilities. The rate of stockpile declines will be a function of the weather. The colder the winter months, the faster the stocks will drop.
We are going into the peak season for demand with the highest level of inventories in years; they could rise to a new record level in a few short weeks. The supply side of the fundamental equation does not support any significant peak season rally.
Meanwhile, 2020 is a unique year for the natural gas market in more ways than one. COVID-19 continues to weigh on demand for natural gas. Moreover, the November 3 US election will determine the future of energy policy in the nation that leads the world in oil and gas output. With less than two weeks to go before the contest, the opposition party has a substantial lead in the polls. They support more regulations and phasing out or eliminating the process of fracking to remove natural gas from the earth’s crust. A shift in the energy policies supported by the political left would lead to less natural gas production in the coming years.
Natural gas is a highly volatile commodity. While the political landscape points to falling supplies over the coming years, the short-term picture presents stockpiles that are more than sufficient to meet all requirements over the coming peak season. The United States Natural Gas Fund (UNG) tracks the price of the volatile futures that trade on the CME’s NYMEX division.
The market expected a 52 bcf injection into storage for the week ending on October 16, 2020
According to Estimize, a crowdsourcing website, the market had projected an average injection of 52 billion cubic feet of natural gas into storage for the week ending on October 16.
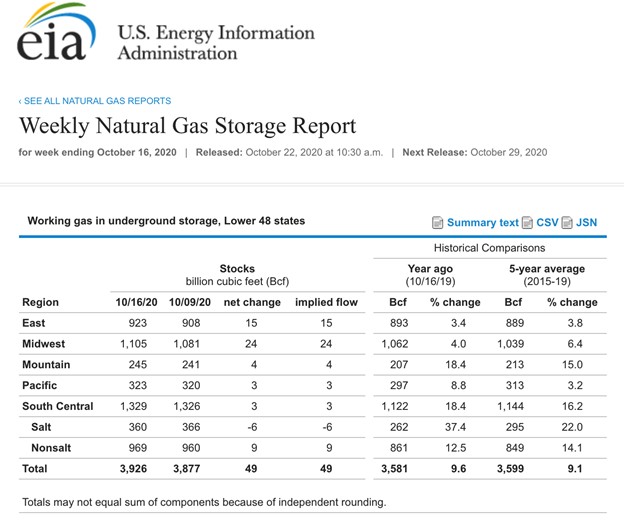
Source: EIA
As the chart shows, the data came in just slightly below the estimate as inventories rose by 49 bcf for the week ending last Friday. The total amount of natural gas in storage across the US was 3.926 trillion cubic feet, 9.6% above last year’s level, and 9.1% above the five-year average for mid-October. It was the twenty-ninth consecutive week where the percentage above last year’s level declined.
Record supplies are on the horizon going into the winter months
With only four weeks left in the 2020 injection season, reaching a new all-time high in stocks above 4.047 tcf is within reach. An average injection of 30.3 bcf would establish a new record in stockpiles going into the peak withdrawal season that begins in November. The bottom line is that there is plenty of natural gas to meet any adverse weather conditions during the coming winter months.
While inventories are bearish for natural gas, the start of the 2020/2021 winter season is unique. The election on November 3 will determine the future path of US energy policy. With the challenger, former vice president Joe Biden, ahead in the polls and the potential for a sweep by the opposition party, the landscape for fossil fuel production in the US could change dramatically beginning in 2021. A stricter regulatory environment and pressure from progressive democrats would likely decrease natural gas output over the coming years.
The price rose to another new high this week- How long can that last?
It seems like the potential for falling production has trumped the high level of inventories as we head into the 2020/2021 withdrawal season. Over the past week, the price of nearby NYMEX natural gas futures rose to a new and higher high above $3 per MMBtu.
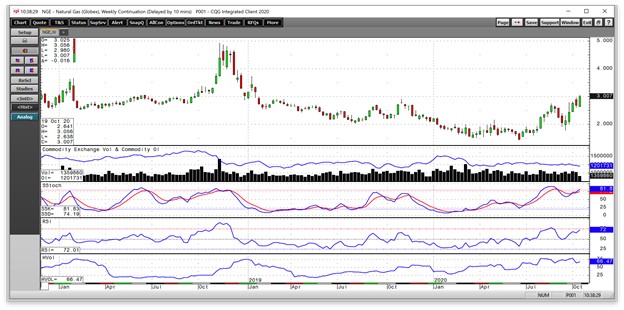
Source: CQG
As the weekly chart illustrates, natural gas has made higher lows and higher highs since trading to the lowest level since 1995 at $1.432 per MMBtu in late June. Over the past week, the price rose to another new high of $3.056 per MMBtu and was trading at just above the $3 level in the aftermath of the EIA’s latest data release.
Open interest, the total number of open long and short positions in the natural gas futures market declined from 1.286 million contracts on October 5 as the price bounced from the latest higher low of $2.373 on the November futures contract. Open interest was at the 1.202 million contract level on October 21. The decline in the metric while the price moved higher is not typically a technical validation of an emerging bullish trend in a futures market. It is likely a sign of short covering by speculative shorts.
Meanwhile, weekly price momentum and relative strength indicators were rising towards overbought conditions with the price north of $3 per MMBtu. Weekly historical volatility at almost 67% is near the high for 2020, given the wide weekly trading ranges since the quarter-of-a-century low in late June.
The technical trend is higher in natural gas. The potential for falling production because of a political shift in the US is rising as we go into the November 3 election. However, stockpiles are approaching an all-time high. The amount of natural gas in storage at the end of last week was already 194 billion cubic feet above last year’s peak. Bullish and bearish factors face the natural gas market as the 2020/2021 peak season comes with the added bonus of an election that will determine the output level. A record high in stocks this November could stand as the high for a long time if the political winds blow to the left. Lower output would lead to higher prices over the coming years. The price action in the natural gas market could be telling us that the high level of stocks could turn out to be a temporary phenomenon.
Want More Great Investing Ideas?
Top 11 Picks for Today’s Market
Dangerous Outlook for Stocks Into Election
5 WINNING Stocks Chart Patterns
UNG shares were trading at $12.58 per share on Thursday afternoon, down $0.06 (-0.47%). Year-to-date, UNG has declined -25.39%, versus a 7.99% rise in the benchmark S&P 500 index during the same period.
About the Author: Andrew Hecht

Andy spent nearly 35 years on Wall Street and is a sought-after commodity and futures trader, an options expert and analyst. In addition to working with StockNews, he is a top ranked author on Seeking Alpha. Learn more about Andy’s background, along with links to his most recent articles. More...
More Resources for the Stocks in this Article
| Ticker | POWR Rating | Industry Rank | Rank in Industry |
| UNG | Get Rating | Get Rating | Get Rating |


