


Join Our Telegram channel to stay up to date on breaking news coverage
ETH Price Prediction – October 29
In the past few days, Ethereum drops from $419 to $380 and the price may likely cross below the moving averages.
ETH/USD Market
Key Levels:
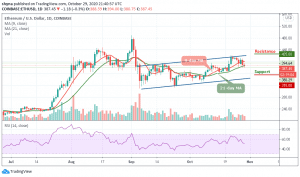
Resistance levels: $425, $435, $445
Support levels: $355, $345, $335

ETH/USD has been following a downward trend within the ascending channel as the coin is currently trading at $387.45. However, the Ethereum price trading around the 9-day and 21-day moving averages. At the opening of the market today, the daily chart shows that the price first went up to $394, where it meets resistance and now falling towards the $380 support level where it begins to correct itself.
Would Ethereum Go Up or Down?
In the early hours of today, the bulls retained control of the market. A couple of days ago, trading has been a resounding victory for the bulls as Ethereum’s price jumped up to touch the monthly high of $421, breaking above the 9-day and 21-day moving averages. Meanwhile, at the time of writing, the daily breakdown shows us that ETH/USD may soon be following the downward movement.
Nevertheless, for a backward movement, the market can be supported by a $375 level, if the price falls below this level; another support may be located around $355, $345, and $335 levels. But should in case the price exceeds the indicated level by breaking above the channel, the resistance levels of $425, $435, and $445 may be visited. The RSI (14) is facing the downtrend, which may likely give more bearish signals.
When compares with BTC, Ethereum (ETH) is currently changing hands at 0.0286 BTC following a heavy bearish moment at the time the market opens today. Looking at the daily chart, the current trend of the coin is perpetually looking bearish in the long-term, moving below the 9-day and 21-day moving averages within the descending channel.
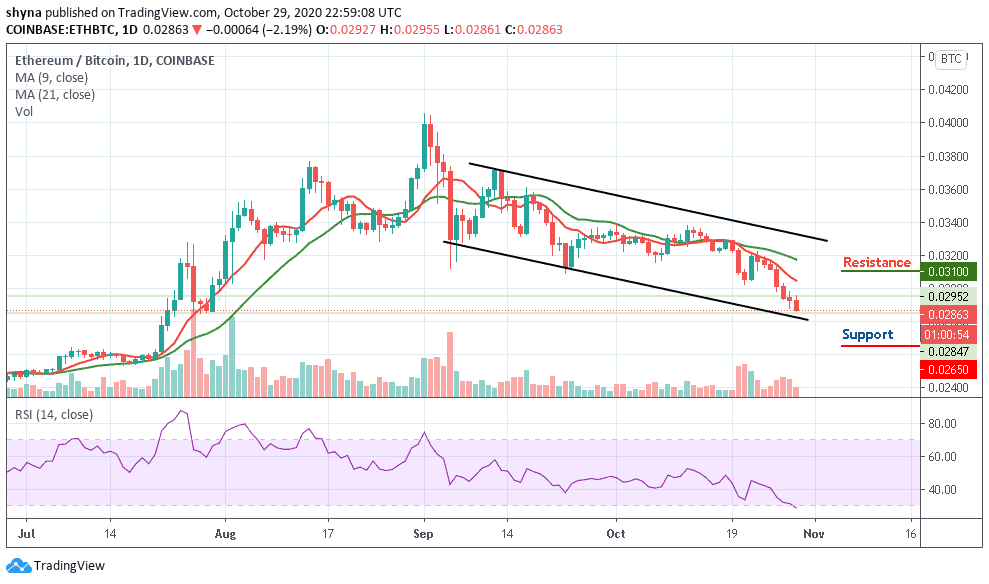
Meanwhile, the resistance levels to look for are 0.031 BTC and above while the closest support levels to keep an eye on are 0.0265 BTC and below. The RSI (14) is moving into the oversold zone, which may continue to give the bearish signals.
Join Our Telegram channel to stay up to date on breaking news coverage
