- US dollar safety trade provides very limited support to the USD/JPY.
- Technical buffering remains weak and distant, descending channel intact.
- Pervasive risk-off markets return amid COVID-19 resurgence in Europe and the US.
- FXStreet Forecast Poll for USD/JPY is neutral to the one-quarter view.
The Japanese yen safe-haven trade was the dominating medium for the USD/JPY this week. A return to partial closures in France and Germany and rising diagnoses of COVID-19 in the United States armed the US dollar in most currency pairs. But for the USD/JPY markets balanced the competing risk-off trades and the pair ended the week in almost the same place at it started.
The five-week low at 104.03 on Thursday was just a touch at the strongest remaining support line and the rebound into Friday reinforced its immediate relevance.
Japanese statistics showed that the economy has not recovered from the global slump of the second quarter. The Bank of Japan lowered its growth forecast and left the overnight call rate unchanged as expected.
In what is the most worrying development for an economy that has flirted with dis-inflation and deflation for two decades consumer prices in Tokyo were negative on the year in October.
The excellent US third quarter GDP at 33.1% (annualized) along with strong Durable Goods Orders, Personal Income and Personal Spending in September, improving Jobless Claims and higher Consumer Sentiment in October were not enough to counter the lure of the island safety of the Japanese yen.
It is a sign of the hold that the pandemic has on markets that neither the general dollar safety-trade or the far better US statistics were enough to raise the USD/JPY.
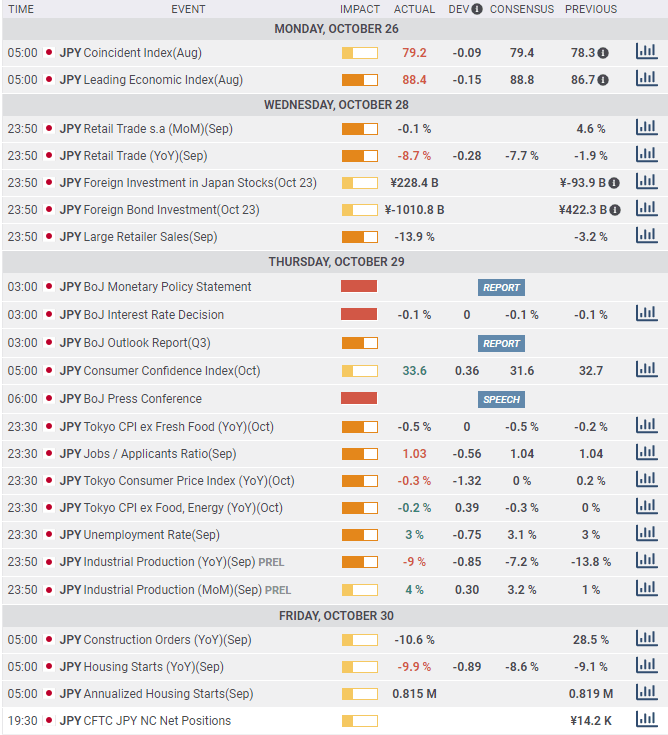
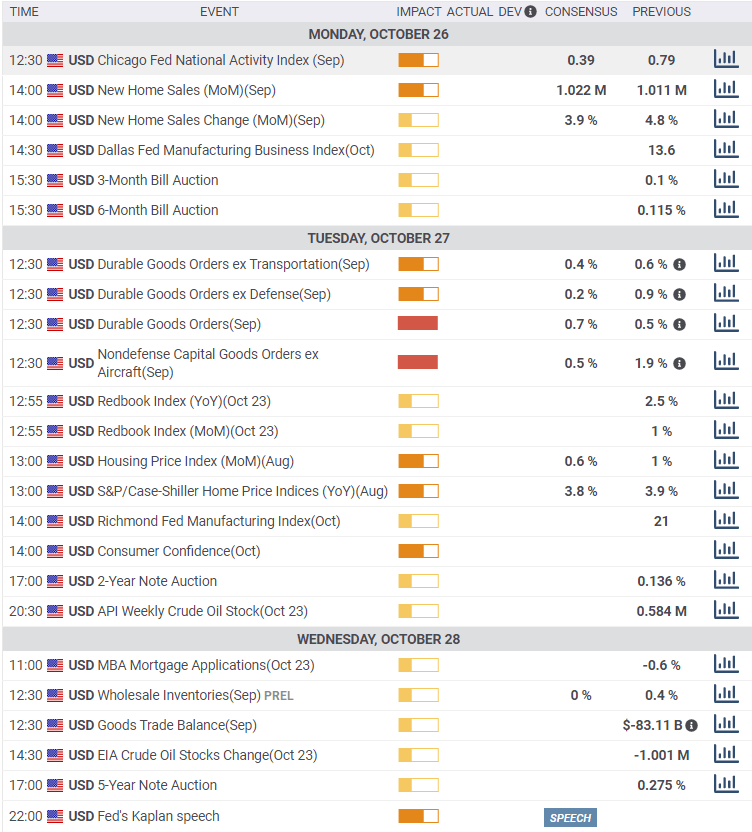
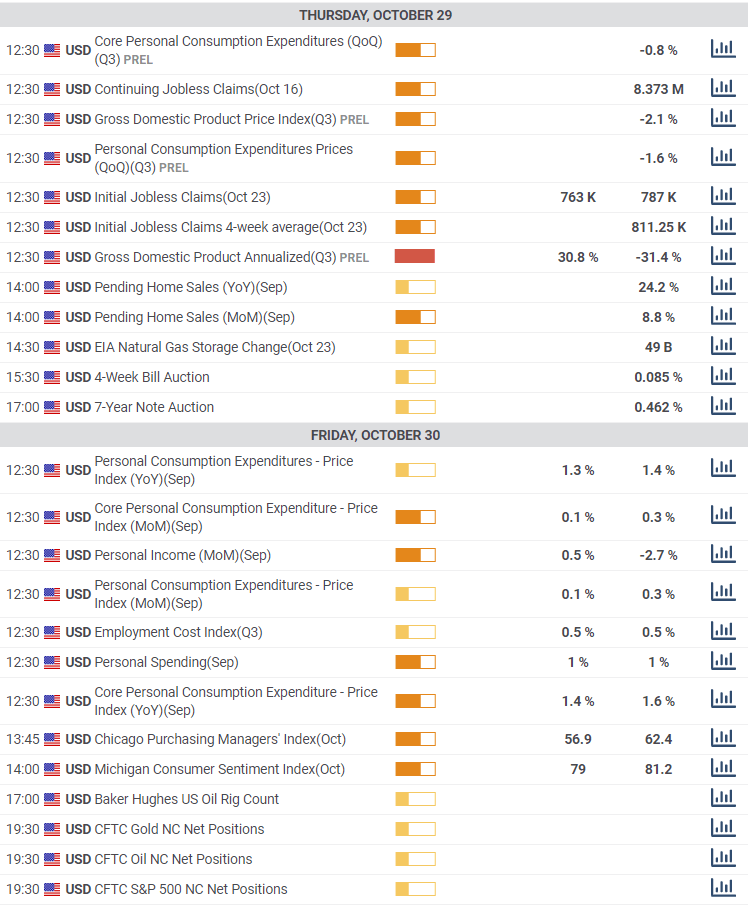
Japan and US statistics October 26-October 30
A busy week for the island nation's reporting confirmed the weak recovery from the global pandemic has stretched to the end of the third quarter. Consumer spending declined more than forecast in several categories and deflation has resurfaced in prices in Tokyo.
The Coincident Index for August, which summarizes the economy in one statistic, was slightly weaker at 79.2 than the 79.4 forecast but up from July's 78.3. Improvement from the May bottom at 73.4 is minimal compared to the 95.5 score in February. The Leading Economic Index for August at 88.4 was also a bit below its 88.8 estimate though higher than July's 86.7. The recovery here from the April 77.7 low is closer to the February reading of 91.7.
Retail Trade (retail sales) fell 8.7% on the year in September, worse than the -7.7% prediction and a sharp decline from August's -1.9% result. It is the seventh decrease in row, a total of 45.9% from March. Large Retailers Sales, the total value of goods sold in large stores, chain convenience stores and supermarkets, fell 13.9% in September after August's 3.2% drop. These sales have also declined for seven months totaling 73.6%.
The Bank of Japan left its base rate at -0.1% as was expected after its Thursday meeting.
Consumer Confidence in October rose slightly to 33.6 from 32.7 prior for the best reading since the pandemic low of 21.6 in April. In January the reading was 39.1.
Tokyo CPI fell 0.3% on the year in October, well below its flat forecast and September's 0.2% tally. It was the lowest monthly price change since March 2017. The core CPI rate YoY dropped 0.2% in the month a bit better than the -0.3% prediction but lower than September's flat pace. It was the largest decline since January 2017.
The Unemployment Rate was stable at 3% in September and has risen from a low of 2.2% in December 2019.
Industrial Production rose 4% in September, better than the 3.2% forecast and a sharp increase from 1% in August. On the year Industrial Production slipped 9%, missing the -7.2% estimate but not as weak as August's -13.9%. Production has fallen for 12 straight months.
Construction Orders fell 10.6% in September from a year ago following the 28.5% jump in August. Housing Starts sank 9.9% in September worse than the 8.6% forecast and the 9.1% decrease in August.
In the US Durable Goods Orders for September at 1.9% on a 0.5% estimate and business spending at 1% over an identical 0.5% forecast combined with the 0.3% positive revision for August to 2.1% confirmed that consumer and business spending was the main support for third quarter GDP.
Initial Jobless Claims and Continuing Claims at 751,000 and 7.756 million in their latest weeks were both the best since March.
Third quarter annualized GDP was 33.1%, more than replacing the 31.4% decline in the previous three months and better than the 31% consensus forecast.
Personal Income at 0.9% in September almost doubled the 0.4% estimate and Personal Spending rose 1.4% on a 1% prediction. Core Personal Consumption Eexpenditures (PCE) prices were 1.5% higher on the year, a bit under the 1.7% projection and the downward revision in August to 1.4% from 1.6% is a sign that rising consumption has not restored pricing power to retailers.
USD/JPY outlook
The attraction of the Japanese yen as an alternative to the US dollar safety-trade, the long-running descending channel and the scarce and weak supporting lines make the case for a lower USD/JPY.
Countering these is general market interest in the US dollar haven and the much better American economic data.
The risk-off trade is a transitory phenomenon, it ebbs and flows with the novelty of news. For the USD/JPY the dueling safety trades of the yen and the dollar effectively neutralize each other. In comparison the dollar rose in every other major currency pair this week except the USD/JPY.
Technically the support at 104.00 is strong but beneath this level the only near-term reference is from the March panic lows which were too brief for meaningful reference. Prior to that there was a brief drop to near 104.50 in March 2018. The USD/JPY has not spent any time below 104.00 since the second half of 2016 and levels from that long ago are indicative at best.
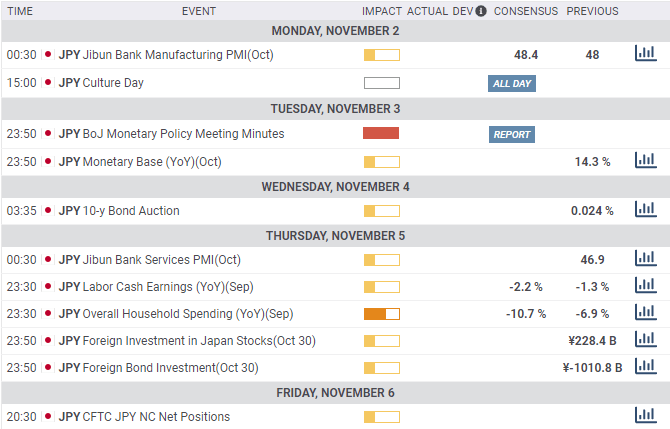
Japan and US statistics November 2-November 6
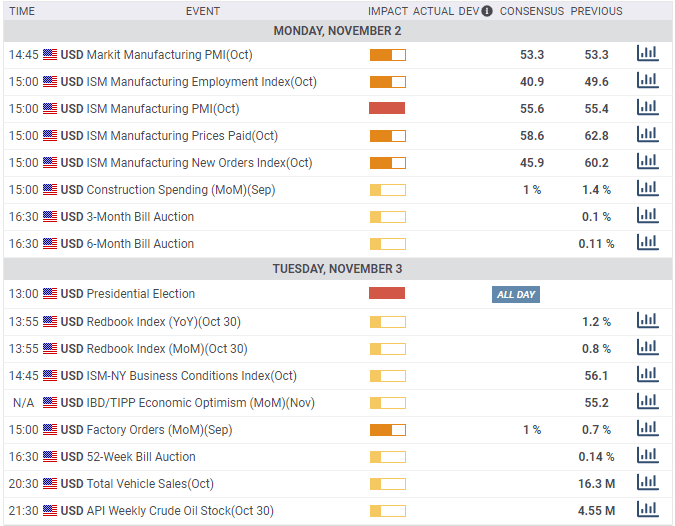
Manufacturing and services purchasing managers' indexes and consumer spending are on tap this week.
On Monday the revision to the Jibun Bank Manufacturing October PMI is out. It is expected to rise to 48.4 from 48. The index has been below the 50 contraction demarcation for 18 straight months. The revision to the Services Index will be released on Thursday.
Overall Household Spending is forecast to decline 10.7% in September after the 6.9% drop in August. Spending has decreased for 11 straight months though August.
Labor Cash Earning are predicted to drop 2.2% in September. They were down 1.3% in August the fifth negative month in a row.
None of this week's numbers will have market impact. The Overall Household Spending data covers the same ground as the Retail Trade numbers.
In the US the main event is the Presidential election on Tuesday. Former Vice-President Joe Biden leads President Donald Trump in the polls but the vote in the decisive swing states of the upper Mid-West is much closer.
Manufacturing PMI from the Institute for Supply Management for October is expected to rise to 55.6 from 55.4. The New Orders Index is forecast to drop into contraction at 45.9 from 60.2. The Employment Index is projected to fall to 40.9 from 49.6.
The Services PMI is forecast to be unchanged at 57.8 in October. Employment is expected to drop to 49.8 from 51.8, New Orders will fall to 49.4 from 61.5. The ADP Employment Change payroll is expected to add 526,000 workers in October after rising 749,000 in September.
Initial Jobless Claims are predicted to rise to 770,000 in the last week in October from 751,000. Continuing Claims are forecast to increase to 8.103 million from 7.756 million.
The Federal Reserve will leave its base rate unchanged after its Thursday meeting and no change is expected in its other economic support programs.
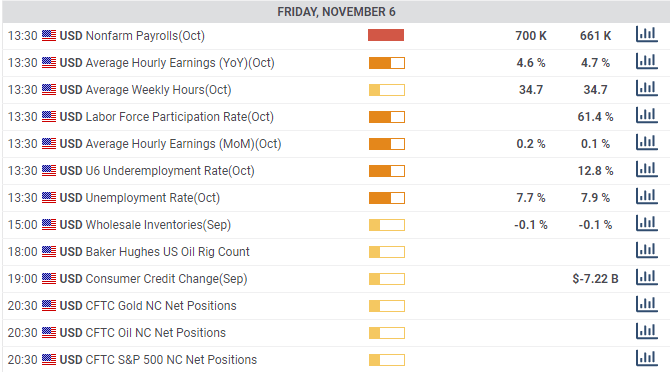
Nonfarm Payrolls for October will add 700,000 new jobs following September's 661,000 addition. The unemployment rate should fall to 7.7% from 7.9%.
US Presidential Election
The US electorate is unusually volatile this year and the election and its aftermath will dominate news and markets. The reaction to the election may be the most important development. The polls have been tightening and the late run looks much like the 2016 vote. If Trump wins the potential for violent protest in many cities seems high.
For markets the question is will US civil unrest, if it happens, play to the dollar's safety status as the COVID-19 cases have or will traders flee to the euro, yen and farther shores? The surpassing rarity of political violence in United States makes the prognosis an unknown of the highest order.

USD/JPY technical outlook
The seven-month old descending channel has spawned a tighter and slightly shallower channel that originates in early July. The width of the original was determined by the volatility around the March market panic and its ebbing residue through June.
The safety-trade to the dollar tends to be a relatively brief and violent episode while the withdrawal of the premium is a drawn-out affair. The March panic climb to over 111.00 and the long retreat that followed is a good example. Trading has paused at 107.00, 106.50, 106.00 and 105.50 on the way down but not at 105.00. The weakness in USD/JPY has combined the overall dollar slide from its pandemic high with the occasional safe-haven trade, which either boosts the yen against the dollar or neuters the greenback's advantage.
The far more plentiful and closely spaced resistance lines add practical weight to the USD/JPY decline.
The Relative Strength Index at 42.03 is higher on Thursday's rebound but the tendency is lower. The 21-day moving average at 105.20 coincides with resistance as does the 100-day at 106.06 and the 200-day at 107.13.
Resistance: 104.75; 105.20; 105.50; 106.00; 106.50; 107.00
Support: 104.00; 103.50; 103.00; 102.40
The lines at 103.50 and 102.40 stem from the second half of 2016. Their application to current trading is limited.
USD/JPY Forecast Poll
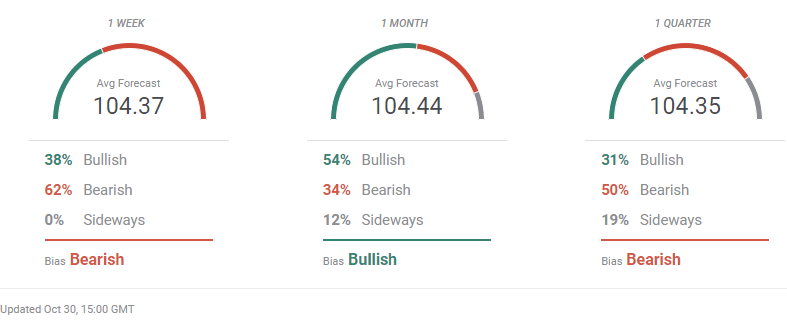
Although the FXStreet Forecast Poll is bearish in the one-week, bullish in the one-month and bearish in the one-quarter, given the proximity of the forecasts they are all essentially neutral. The USD/JPY closed the week at 104.67 just points below its open at 104.77. As we noted last week the descent has lost its downward energy and logic but until the pandemic safety-trade is exorcised and the market can return to economic comparisons, the drift lower will prevail.
Information on these pages contains forward-looking statements that involve risks and uncertainties. Markets and instruments profiled on this page are for informational purposes only and should not in any way come across as a recommendation to buy or sell in these assets. You should do your own thorough research before making any investment decisions. FXStreet does not in any way guarantee that this information is free from mistakes, errors, or material misstatements. It also does not guarantee that this information is of a timely nature. Investing in Open Markets involves a great deal of risk, including the loss of all or a portion of your investment, as well as emotional distress. All risks, losses and costs associated with investing, including total loss of principal, are your responsibility. The views and opinions expressed in this article are those of the authors and do not necessarily reflect the official policy or position of FXStreet nor its advertisers. The author will not be held responsible for information that is found at the end of links posted on this page.
If not otherwise explicitly mentioned in the body of the article, at the time of writing, the author has no position in any stock mentioned in this article and no business relationship with any company mentioned. The author has not received compensation for writing this article, other than from FXStreet.
FXStreet and the author do not provide personalized recommendations. The author makes no representations as to the accuracy, completeness, or suitability of this information. FXStreet and the author will not be liable for any errors, omissions or any losses, injuries or damages arising from this information and its display or use. Errors and omissions excepted.
The author and FXStreet are not registered investment advisors and nothing in this article is intended to be investment advice.
Recommended Content
Editors’ Picks
AUD/USD remained bid above 0.6500

AUD/USD extended further its bullish performance, advancing for the fourth session in a row on Thursday, although a sustainable breakout of the key 200-day SMA at 0.6526 still remain elusive.
EUR/USD faces a minor resistance near at 1.0750

EUR/USD quickly left behind Wednesday’s small downtick and resumed its uptrend north of 1.0700 the figure, always on the back of the persistent sell-off in the US Dollar ahead of key PCE data on Friday.
Gold holds around $2,330 after dismal US data

Gold fell below $2,320 in the early American session as US yields shot higher after the data showed a significant increase in the US GDP price deflator in Q1. With safe-haven flows dominating the markets, however, XAU/USD reversed its direction and rose above $2,340.
Bitcoin price continues to get rejected from $65K resistance as SEC delays decision on spot BTC ETF options

Bitcoin (BTC) price has markets in disarray, provoking a broader market crash as it slumped to the $62,000 range on Thursday. Meanwhile, reverberations from spot BTC exchange-traded funds (ETFs) continue to influence the market.
US economy: slower growth with stronger inflation

The dollar strengthened, and stocks fell after statistical data from the US. The focus was on the preliminary estimate of GDP for the first quarter. Annualised quarterly growth came in at just 1.6%, down from the 2.5% and 3.4% previously forecast.