Join Our Telegram channel to stay up to date on breaking news coverage
Bitcoin Price Prediction – February 28
Today’s trading session has not seen a tangible move to suggest any reasonable definite market direction differently. Therefore, the BTC/USD still trades around the trend-line of 14-day SMA until the present.
BTC/USD Market
Key Levels:
Resistance levels: $50,000, $55,000, $60,000,
Support levels: $40,000, $35,000, $30,000
BTC/USD – Daily Chart
Bitcoin has not had a sign of survival as price still trades around the trend-line of the 14-day SMA. The formation of bearish candlesticks around the smaller trend-line still carries a weight-force. The 50-day SMA is underneath the smaller SMA at the $35,000 level. That still indicates that the BTC/USD market is in a bullish trend to some extent. The Stochastic Oscillators are dipped into the oversold region to suggest a slow-active move may potentially occur in a near trading session. That calls for traders need to stay away from placing a position for a while.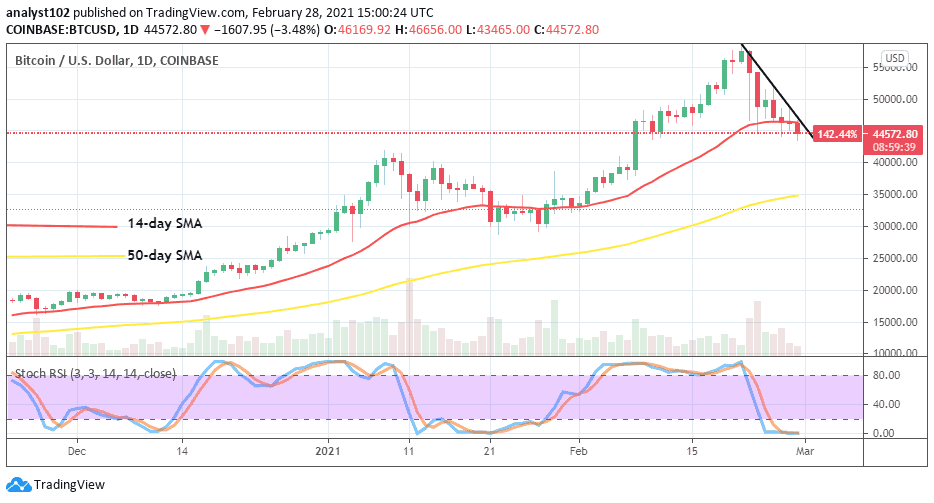
What could be the next price action of the BTC/USD market?
Currently, it appears that the BTC/USD trading session is in a relaxing moving mode as price hovers around the value of the $45,000 mark. Bulls are seemingly taking their time to locate a support level to build up strength. In the light of that, they may be getting that if the market eventually pushes downward to only test a low value around the $40,000 immediate support level. A sudden spike is needed to take a form against the trend-line of the 14-day SMA.
For a decent bearish price elongation in this crypto-trade to happen, a violent rejection at $50,000 will have to play out. And, that may allow bears to bring down the trade-value to a low around the $40,000 support level. Meanwhile, such a falling force may feature in a slow-serial moving formation. But, in a more panicking mood, bears may extend the forces to lower support of $35,000.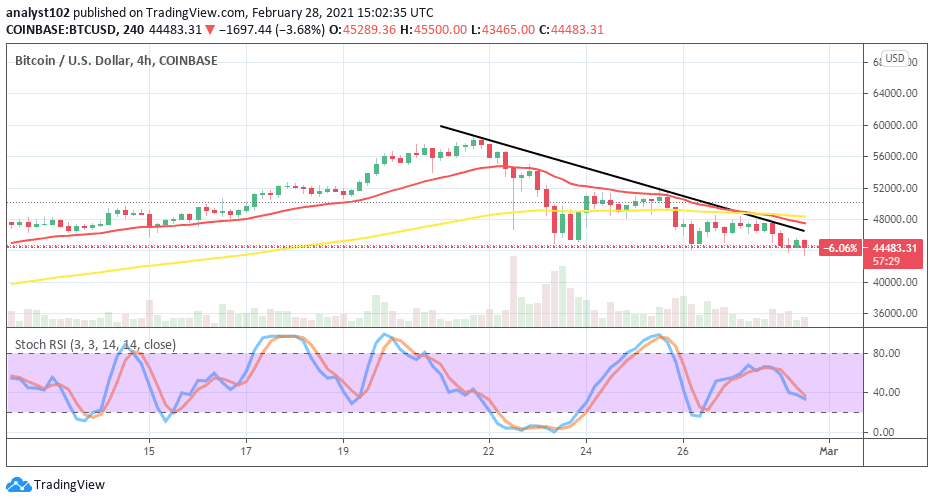
BTC/USD 4-hour Chart
The 4-hour chart depicts that the US dollar still enjoys a kind of valuation at expense of a decline in Bitcoin’s market-worth. As of the time of writing, price moves to trade around a critical low-point of $44, 000. The 50-day SMA trend-line has been slightly intercepted from the top to show the intensity of the present decline pressures. The Stochastic Oscillators now bent briefly to the south at range 40. That shows that the BTC/USD market still stands a risk of seeing a low-move to around $40,000. Meanwhile, the crypto-economy may as well witness a line of range-bound movement around the $45,000 and $40,000 while the two major market-movers hold positions tightly within the two mentioned trading levels.
Join Our Telegram channel to stay up to date on breaking news coverage