The watchlist for the week ahead consists of a couple of compelling day trading opportunities for the open as well as plenty of action down the line following the higher volatility and sharp moves of last week.
We have GBP/JPY, and GBP/CHF (correlated pairs) for which are priorities of the list for the open, while swing trading opportunities are located in EUR/USD, AUD/USD, CHF/JPY, GBP/CHF, GBP/AUD and EUR/AUD.
GBP/JPY hourly chart
-637501538292033620.png)
The price made a higher high only to pull back to test old resistance turned support. Bulls could well re-engage at this juncture.
A -61.8% Fibonacci measurement of correction offers 149.40 as an upside target.
15-min chart
-637501537408579296.png)
Conditions on the 15-min chart are mixed with MACD in positive territory while the price is below the 21 moving average and resistance. If price moves higher in the open and breaks resistance, there are high probabilities of a higher-high for the sessions ahead, as there are for GBP/CHF:
GBP/CHF hourly chart
-637501404601847589.png)
15-min chart
-637501406559776323.png)
EUR/USD daily chart
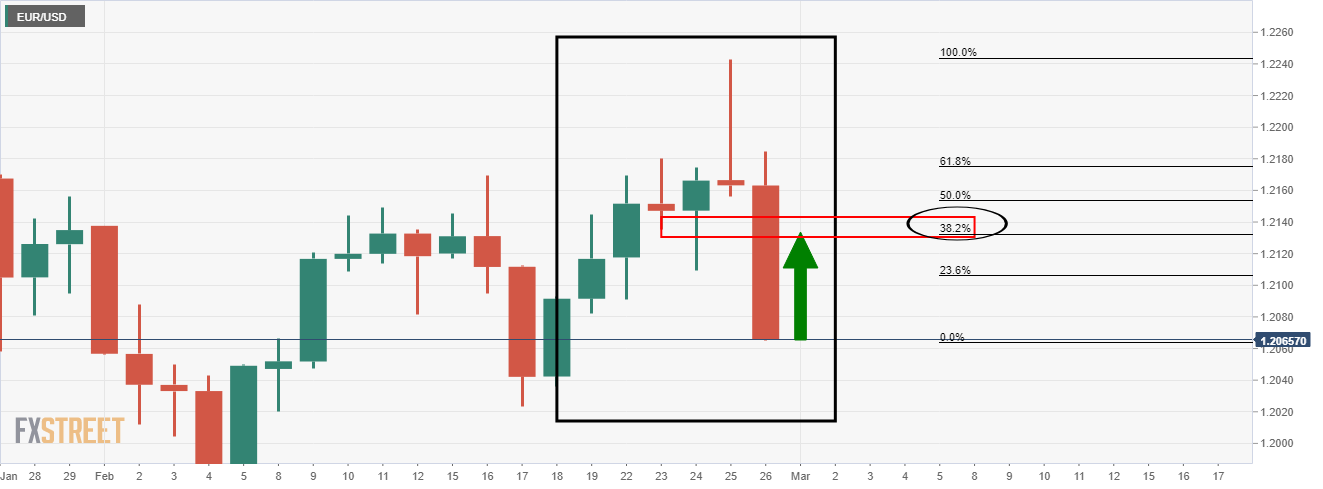
The M-formation is a bullish pattern where the price would be expected to revert back to test the neckline and prior support, or, to at least the 38.2% Fibonacci level.
EUR/USD hourly chart
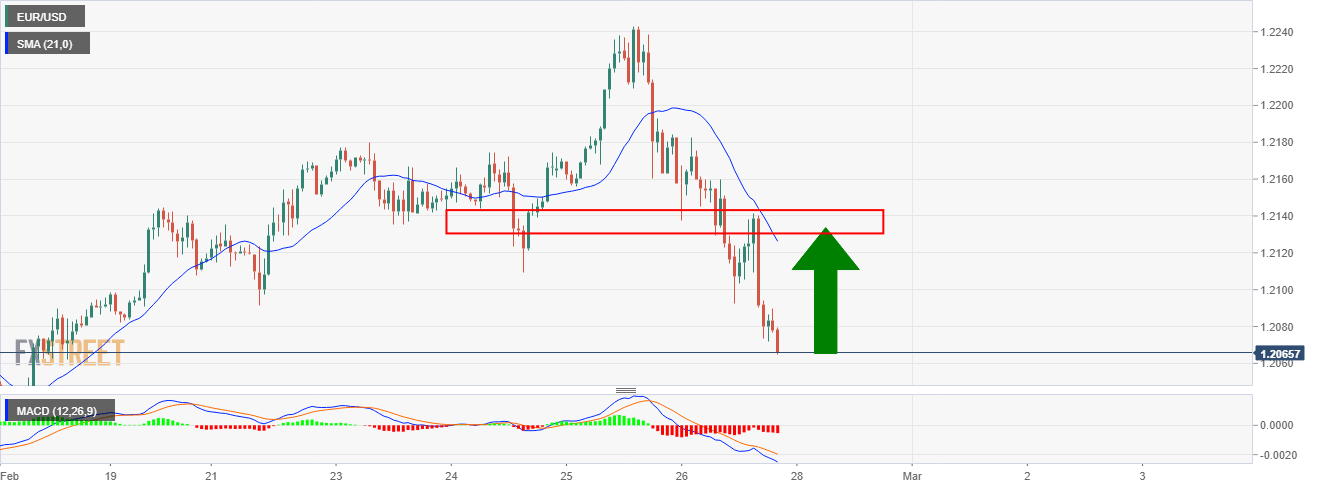
There is some work to do yet while the price is below the 21-moving average. However, a period of consolidation and a gradual grind to the upside would be expected to draw in the MA and offer more favourably bullish technical conditions.
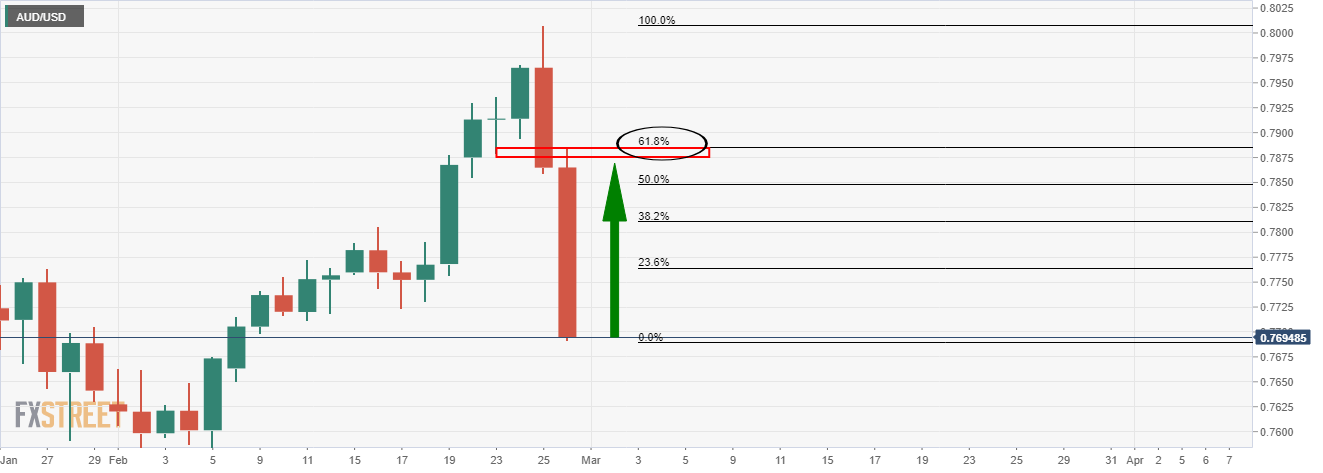
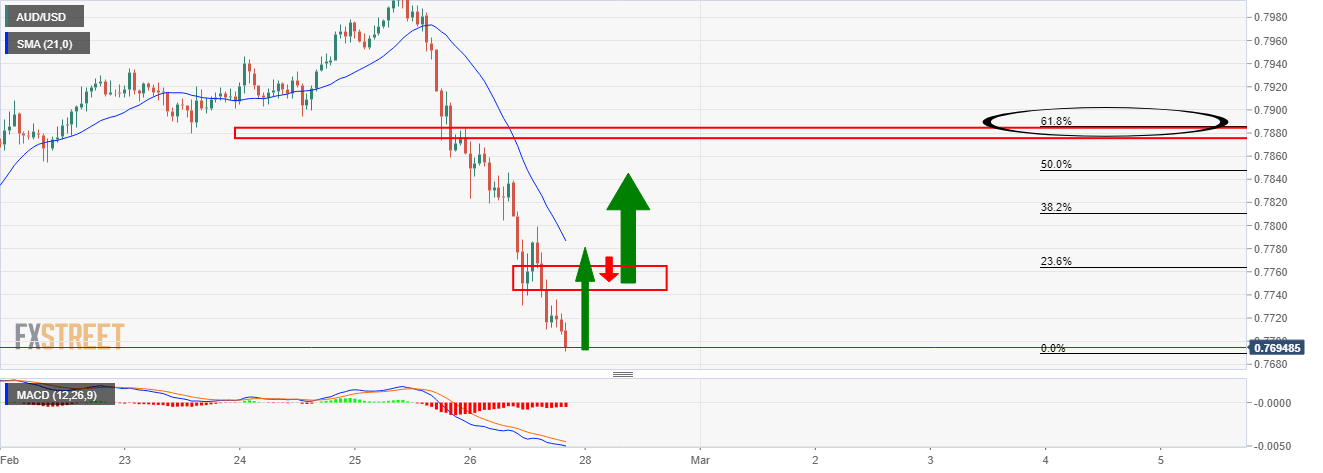
We have a similar situation in AUD/USD:
CHF/JPY daily chart
-637501423490471187.png)
The price has been rejected at the neckline of the M-formation and would be now expected to deteriorate in a fresh daily impulse to the downside.
4-hour chart
-637501426628161145.png)
In clearing support, the price would be expected to restest the structure and the commitments of the bears at the 21-moving average.
EUR/AUD, daily chart
-637501430246291187.png)
With the price meeting resistance, there is a high probability that the bears will retest the bull's commitments at old resistance which has a confluence with the 62% Fibonacci retracement.
The hourly chart can be monitored for bearish technical conditions
-637501433894280344.png)
AUD/CAD daily chart
-637501435884807384.png)
1-hour chart
-637501438160021862.png)
The price action will determine bullish conditions on a break of the current resistance from which bulls can begin to look for a bullish structure to form for an optimal entry point to target old support and the neckline of the M-formation.
The reverse can be said of GBP/AUD:
GBP/AUD daily chart
-637501442707646422.png)
GBP/AUD hourly chart
-637501444093480513.png)
Information on these pages contains forward-looking statements that involve risks and uncertainties. Markets and instruments profiled on this page are for informational purposes only and should not in any way come across as a recommendation to buy or sell in these assets. You should do your own thorough research before making any investment decisions. FXStreet does not in any way guarantee that this information is free from mistakes, errors, or material misstatements. It also does not guarantee that this information is of a timely nature. Investing in Open Markets involves a great deal of risk, including the loss of all or a portion of your investment, as well as emotional distress. All risks, losses and costs associated with investing, including total loss of principal, are your responsibility. The views and opinions expressed in this article are those of the authors and do not necessarily reflect the official policy or position of FXStreet nor its advertisers. The author will not be held responsible for information that is found at the end of links posted on this page.
If not otherwise explicitly mentioned in the body of the article, at the time of writing, the author has no position in any stock mentioned in this article and no business relationship with any company mentioned. The author has not received compensation for writing this article, other than from FXStreet.
FXStreet and the author do not provide personalized recommendations. The author makes no representations as to the accuracy, completeness, or suitability of this information. FXStreet and the author will not be liable for any errors, omissions or any losses, injuries or damages arising from this information and its display or use. Errors and omissions excepted.
The author and FXStreet are not registered investment advisors and nothing in this article is intended to be investment advice.
Recommended content
Editors’ Picks
AUD/USD tumbles toward 0.6350 as Middle East war fears mount

AUD/USD has come under intense selling pressure and slides toward 0.6350, as risk-aversion intensifies following the news that Israel retaliated with missile strikes on a site in Iran. Fears of the Israel-Iran strife translating into a wider regional conflict are weighing on the higher-yielding Aussie Dollar.
USD/JPY breaches 154.00 as sell-off intensifies on Israel-Iran escalation

USD/JPY is trading below 154.00 after falling hard on confirmation of reports of an Israeli missile strike on Iran, implying that an open conflict is underway and could only spread into a wider Middle East war. Safe-haven Japanese Yen jumped, helped by BoJ Governor Ueda's comments.
Gold price jumps above $2,400 as MidEast escalation sparks flight to safety

Gold price has caught a fresh bid wave, jumping beyond $2,400 after Israel's retaliatory strikes on Iran sparked a global flight to safety mode and rushed flows into the ultimate safe-haven Gold. Risk assets are taking a big hit, as risk-aversion creeps into Asian trading on Friday.
WTI surges to $85.00 amid Israel-Iran tensions

Western Texas Intermediate, the US crude oil benchmark, is trading around $85.00 on Friday. The black gold gains traction on the day amid the escalating tension between Israel and Iran after a US official confirmed that Israeli missiles had hit a site in Iran.
Dogwifhat price pumps 5% ahead of possible Coinbase effect

Dogwifhat price recorded an uptick on Thursday, going as far as to outperform its peers in the meme coins space. Second only to Bonk Inu, WIF token’s show of strength was not just influenced by Bitcoin price reclaiming above $63,000.