
The Gold To Housing Ratio As A Valuation Indicator
The Gold to Housing ratio is a quite useful measure for comparing the relative values of single family homes and gold, and it also has an interesting historical track record for identifying turning points in long-term gold price trends. After the pandemic-related economic events of 2020 and with the continuing strength in housing – it is worthwhile revisiting this basic measure, because the results aren't at all what most people likely think they are.
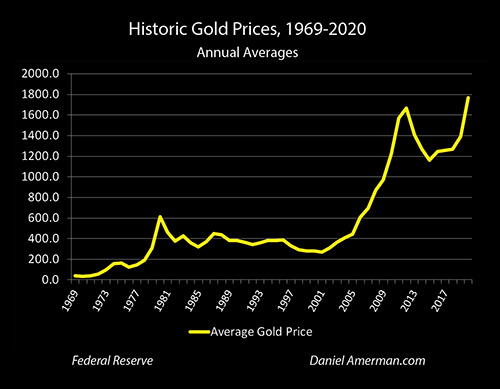
The average price for an ounce of gold in 2020 was $1,770, which set the all time record. The pandemic was clearly a good time to be a gold investor. However, there was more to it than just the pandemic, with gold climbing every year on an average annual basis since the trough of $1,160 in 2015.
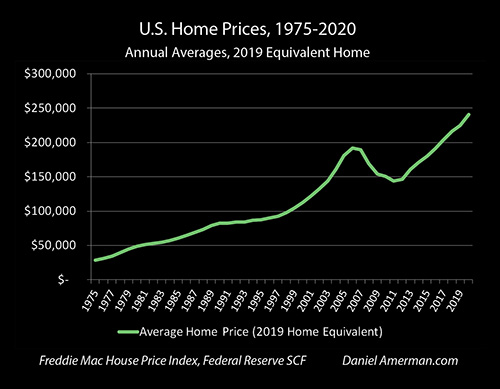
Homes were also shooting upwards in price at the same time, with the median U.S. home reaching a value of about $241,000 in 2020 on an annual average basis. This was up from a trough of about $144,000 in 2011, meaning that the average home gained almost $100,000, or 67% in nine years.
(The median home price is based upon the Federal Reserve's triennial 2019 Survey of Consumer Finances, which is usually considered a definitive source for U.S. consumer finances. It was adjusted for 2020 using the Freddie Mac House Price Index. More information can be found in the methodology notes linked here.)
Gold and real estate are two types of "hard assets" that are often bought as alternative investments, either because people are seeking fundamental diversification from financial assets such as stocks and bonds, or because they are concerned about inflation.
As the U.S. debt explodes upwards even while new stock price records are being set in the midst of unprecedented global economic devastation, with what is holding the markets and the nation together being effectively funded by monetary creation by the Federal Reserve - many people would argue that this is particularly good time to be invested in tangible assets that are inflation hedges.
However, while real estate and gold are each hard assets and can be powerful inflation hedges – they don't tend to move together in real terms. In this analysis we will examine the history of the two assets to get a measure of relative value, and find which asset currently looks cheaper than the other when compared to thelong term norms of their relationship.
This analysis is part of a series of related analyses, which support a book that is in the process of being written. Some key chapters from the book and an overview of the series are linked here.
The Gold To Housing Ratio

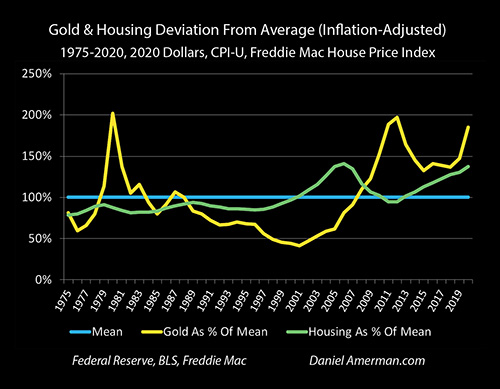
The differences between the two hard assets can be clearly seen when we adjust historical prices for inflation, as shown above.Both investments do oscillate up and down around long term averages over the last almost half century, but they so in quite different cycles, with their peaks and valleys generally occurring in different years.
History shows that if you can buy gold "cheap" while real estate is relatively "expensive", then on an asset price basis gold is likely to strongly outperform real estate as an investment, all else being equal.
Conversely, when real estate is "cheap" and gold is "expensive" relative to its long-term averages, then it is real estate that is likely to powerfully outperform gold as an investment over the long term.
But what exactly is "cheap" and what is "expensive"?Answering that question is where the Gold to Housing ratio is quite useful. As there is no dollar component in the ratio itself, the inflation index and measurement concerns drop out, and we are left with the value of two of the most popular hard asset investments relative to each other.

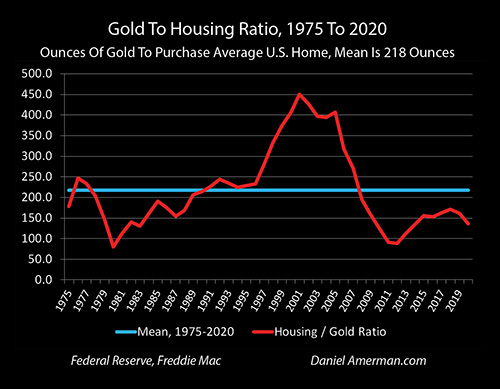
The Gold to Housing ratio is a measure of relative value between gold and real estate. It is the number of ounces of gold required to purchase an average single family home in the United States.
When we take the $241,000 median national price for an existing single family home and divide it by the $1,770 annual average price to buy an ounce of gold, we come up with a Gold to Housing ratio for 2020 of 136, meaning it took 136 ounces of gold to purchase an average single family home.
More information on the specifics are included in the methodology notes, including why it is called the Gold to Housing ratio herein rather than the Housing/Gold ratio. (Briefly, the mathematical calculation itself is the price of Housing divided by the price of Gold, the output of the calculation is the readily understandable ratio of the number ounces of Gold needed to buy an average House.)
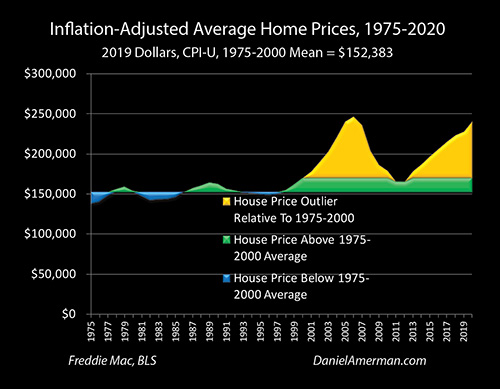
The long-term average is represented by the blue line in the above graphic.Since 1975, it has taken an average of 218 ounces of gold to purchase an average single family home, meaning that the current price of 136 ounces is equal to 62% of the long term average.
There have been three major turning points in the valuation relationship between gold and real estate over those years.
The first turning point occurred at the peak of financial crisis in 1980 when it took only 80 ounces of gold to buy a house (on an annual average basis). Real estate was remarkably cheap relative to gold – and real estate investments would outperform gold by a huge margin over the next 21 years to come.
The second turning point occurred in 2001, with the Gold to Housing ratio reaching a high of 450 ounces of gold being needed to buy a single family home. Gold was remarkably cheap relative to real estate – and it was then gold asset prices that would outperform real estate asset prices by a huge margin over the next 11 years.
On an annual average basis, the third turning point occurred in 2012, when 88 ounces of gold was enough to purchase an average single family home. Real estate was once again remarkably cheap when compared to gold, real estate powerfully outperformed gold in the years through 2018 in particular, and this was particularly true for homes owned with mortgages.
Key Current Analysis Results
Below is a quick summary of 8 key points about the Gold to Housing ratio in 2020. The background information which follows then further explains the ratio and its history.
1) Gold and housing are each above their long term averages in inflation-adjusted terms, with gold being priced much higher relative to its average valuation than what we see with housing.
2) While both housing and gold had very good years, the annual average price for gold rose much faster in 2020 than did the price for homes, with percentage gains of 27.2% for gold versus 5.7% for the increase in home prices. This gain was almost 5X greater for gold than homes, and was enough to move the ratio in a single year from 162 ounces of gold to buy a home, down to 136 ounces.
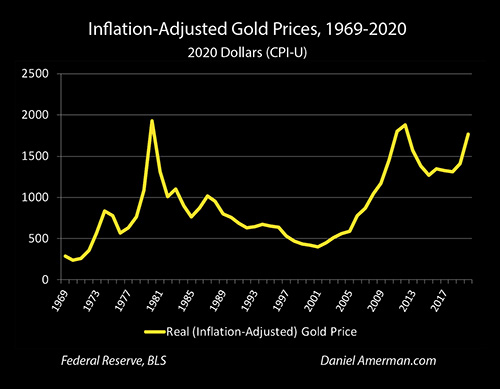
3) Gold is not acting as a "stable store of value", because that is a myth in modern times. Instead gold has been acting as something much rarer and more desirable - which is as a contracyclical crisis hedge. This can be clearly seen with the three spikes in value that correspond to crisis and perception of crisis, and led to peak gold valuations in inflation-adjusted terms that were more than four times as high as the lowest annual average. However, this can be problematic for buy and hold strategies at current price levels, when people think they are buying a stable store of value, particularly when inflation taxes are taken into account as analyzed here.
4) As an inflation hedge, and as explored in Chapter 16 (link here), gold is behaving exactly as expected, and experiencing asset inflation in inflation-adjusted terms as market expectations of crisis are rising, which unlocks far more upside potential than would exist if gold were a mere stable store of value. If full blown crisis does develop, then gold still has substantial upside potential, even with its high current valuation by historical standards. Indeed, in nominal terms (non inflation-adjusted) there is still room for a spectacular upside for gold in the event of monetary crisis.
5) Real estate is not at a peak when inflation is taken into account, but on a national basis, U.S. single family home prices are at the highest levels they have ever been outside of the bubble of the 2000s.
6) As explored in the book chapter linked here, detailed analysis of almost half a century of home prices and inflation proves that the track record for using homes to Turn Inflation Into Wealth is much stronger than is commonly understood, whether one is looking at homeownership or owning income properties. This would then imply that having higher than normal home prices simultaneously with higher than normal gold prices would be entirely rational if there are widespread concerns about substantially higher future rates of inflation.
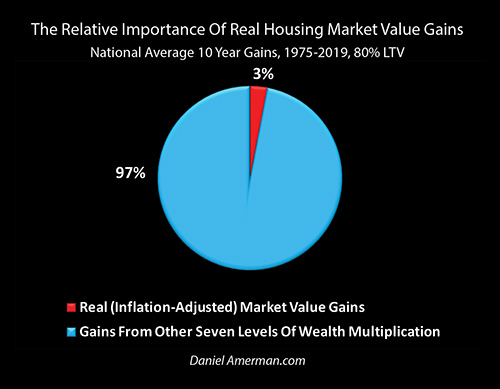
7) Real (inflation-adjusted) housing prices are indeed very important, but as explored in the book chapter linked here, by themselves they are only one of the eight levels of the multiplication of wealth for housing, accounting for only 3% of national average ten year home equity increases by themselves. The other 97% is from the other seven levels of the multiplication. This sets up a fascinating contrast between the two quite powerful inflation hedges of gold and housing, and the quite different means by which each hard asset can profit from inflation, with the upside potential being substantially greater with either asset than what is currently commonly understood.
8) In the event of crisis and over the short term, gold would likely strongly outperform housing, there could certainly be another round or more of gold prices rising 5+ times faster than home prices. However, from a long term perspective - gold is highly overvalued relative to single family homes. A return to the long-term average of the Gold to Housing ratio of 218 ounces from the current level of 136 would mean that housing would rise in value relative to gold by about 60%. This could occur by housing increasing in value faster than gold does, or by gold falling in value. What the ratio measures is relative valuation.
If there is a monetary crisis, and if a liability has been used as part of an asset/liability management strategy, then over the long term and after the crisis has receded, income properties on a national average basis should outperform gold by much more than 60%, and perhaps a multiple thereof. This is only true, however, if the strategy can survive a crisis environment that would likely destroy many traditional real estate leverage strategies.
(Based on intensive study of 50 years of data, an even stronger contracyclical relationship in secular cycles can be found when we compare gold to stocks, as explored in the analysis linked here.)
Three For Three Correlation
There is another fascinating feature about theGold to Housing ratio outliers, when measured on the basis of annual averages. This can be seen when we compare the graphs below, looking at the highs and lows for inflation-adjusted gold prices, and the corresponding years for the Gold to Housing Ratio.
1) The peak annual average price for gold in inflation-adjusted terms in the modern era occurred in 1980 at $1,926 an ounce (2020 dollars). That same year, the Gold to Housing ratio bottomed out at 80 ounces to buy a house.
2) The lowest price for gold in inflation-adjusted terms in the modern era occurred in 2001, when gold fell to $396 an ounce (2020 dollars).That same year, the Gold to Housing ratio peaked out at 450 ounces to buy a house.
3) The second peak and the second highest price for gold in inflation-adjusted terms in the modern era occurred in 2012 at $1,881 an ounce (annual average, 2020 dollars). That same year, the Gold to Housing ratio again bottomed out at 88 ounces to buy a house.
In all three instances, there was a 100% correlation when we look at the peak and bottom values for gold in inflation-adjusted dollar terms, and the bottom and peak values for the Gold to Housing ratio.
Another way to view this is that while looking at gold in inflation-adjusted terms is very useful for identifying extreme valuations that may mark a turning point in the market, it is limited by the accuracy of the inflation measures.
As a recent example, government inflation statistics claim that the annual rate of inflation in 2020 was a mere 1.25%. But yet, 2020 was also a year of supply chain problems creating significantly higher food prices in many cases, along with generally higher prices for anything using semiconductor chips, not to mention soaring lumber prices along with many other home renovation or home building supplies. For the reader - did your cost of living or doing business really only go up by 1.25%?
If we can't come up with an actual inflation number for each year that we believe to be accurate, then determining whether gold is undervalued or overvalued becomes problematic over a multiyear or multi-decade period, because we can't trust our data.
The advantage to the Gold to Housing ratio is that because the value of one tangible asset is being measured in terms of another tangible asset, the dollars drop out of the equation – and so do any concerns about the accuracy of the inflation measure.
This works both ways, and could be even more important for evaluating home prices. If we accept government inflation statistics, then the housing market may be looking overvalued to many people.
However, if we don't fully trust the government when it comes to reporting inflation, and we compare a ratio of the hard asset of gold to the hard asset of housing, with inflation statistics dropping out - then the seemingly high valuations in inflation-adjusted terms can partially or even entirely disappear, and we are left with home prices that are actually substantially undervalued relative to gold when compared to long term averages.
It is also worth noting that the Gold to Housing ratio works differently in the other direction when it comes to calling peaks. That is, it did not call the peak in the real estate bubble – far from it.Instead, this ratio of relative values said that real estate reached its maximum peak relative to gold in 2001, right at the very time that the bubble was just starting to make an appearance.So the information value of the ratio was not to provide market timing for speculative trading within a bubble – but rather was a signal to long-term investors that a bubble was beginning.
Interestingly enough, we are not seeing that signal again at this time, but rather the opposite. The current Gold to Housing ratio of 136 is only 30% of its previous peak of 450 in the year 2001.
The Gold to Housing ratio has a long and interesting history, and hopefully this analysis has been of help to you in providing a different perspective than what is currently being seen in the headlines about gold and home prices.
Learn more about the free book.
Disclosure: This analysis contains the ideas and opinions of the author. It is a ...
more

