British Pound (GBP) Latest: GBP/USD To Extend Near-Term Downtrend
GBP/USD DOWNTURN TO CONTINUE NEAR-TERM
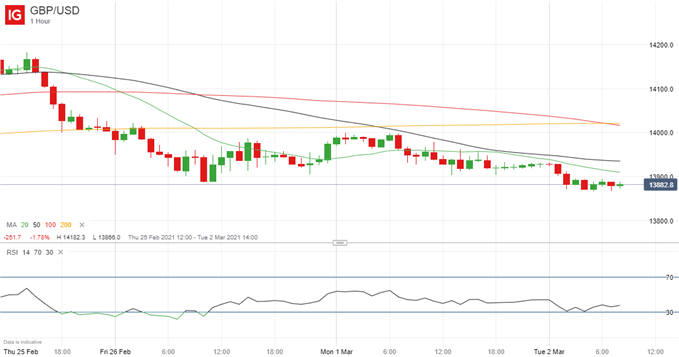
The downward trend in GBP/USD that began in the middle of last week looks set to continue near-term as the US Dollar benefits from forecasts of a strong US economic recovery after the damage caused by the coronavirus pandemic. Moreover, the US Federal Reserve seems willing to tolerate higher US Treasury yields.
GBP/USD PRICE CHART, ONE-HOUR TIMEFRAME (FEBRUARY 24 – MARCH 2, 2021)
Source: IG (You can click on it for a larger image)
Note though that the longer-term trend higher in GBP/USD that began almost a year ago remains intact and that there is support for the pair at 1.3728, where the 50-day moving average checks in, at the 1.37 round number and then at 1.3474, where the 100-dma lies. The latest move may well turn out, therefore, to have been a healthy correction after the previous strong gains, particularly as the 14-day relative strength index has moved lower after previously signaling an overbought market.
UK BUDGET IN FOCUS
From a Sterling perspective, the next big event will be Wednesday’s Budget, when UK Chancellor of the Exchequer Rishi Sunak will announce his plans for future taxation and spending. However, the markets will likely focus on the March economic and fiscal forecasts from the Office for Budget Responsibility that will be published immediately after the Chancellor’s speech.
Disclosure: See the full disclosure for DailyFX here.


