
Gold Prices At Risk, Crude Oil Sinks But Broader Uptrend Remains Intact
Both gold and WTI crude oil prices started off the new week on a sour note, falling 0.47% and 2.17% respectively. Greatly fueling weakness in the commodities space as of late likely has been rising longer-term Treasury rates in the United States. This has also been benefiting the US Dollar. A rising Greenback can work to pressure commodities that are heavily priced in the currency around the world.
While the 10-year Treasury yield was little changed on Monday, following a steep selloff on Friday, the 30-year rate climbed. This likely pressured anti-fiat gold prices, especially as better-than-expected ISM manufacturing data crossed the wires. Meanwhile, Richmond Fed President Thomas Barkin expressed his calm about rising bond yields, reinforcing the notion that the central bank remains to be worried about them.
Crude oil prices are weakening ahead of this week’s OPEC+ Joint Ministerial Monitoring Committee meeting on March 3rd. Investors may be speculating that the oil-producing cartel may hint at gradually restoring output as the global economy recovers from the coronavirus pandemic. This is also raising the odds of disappointment, meaning a lack of material changes to output could restore momentum to WTI.
Heading into the remaining 24 hours of Tuesday, market sentiment is off to a slightly pessimistic setting given the APAC trading session. This is placing crude oil prices under pressure as the commodity remains at risk ahead of the OPEC+ meeting. But, oil may struggle to find meaningful conviction until this event passes. Gold is also lower as the haven-oriented US Dollar is benefiting from the ‘risk-off’ tone.
Gold Technical Analysis
Gold is pressuring the 78.6% Fibonacci extension at 1715. Confirming a daily close under this price would expose the 1658 – 1678 support zone from last year – see chart below. Moreover, XAU/USD confirmed the break under the November low, opening the door to resuming what has been the key downtrend since August. In the event of a bounce, keep a close eye on falling resistance from December.
Gold Daily Chart
(Click on image to enlarge)
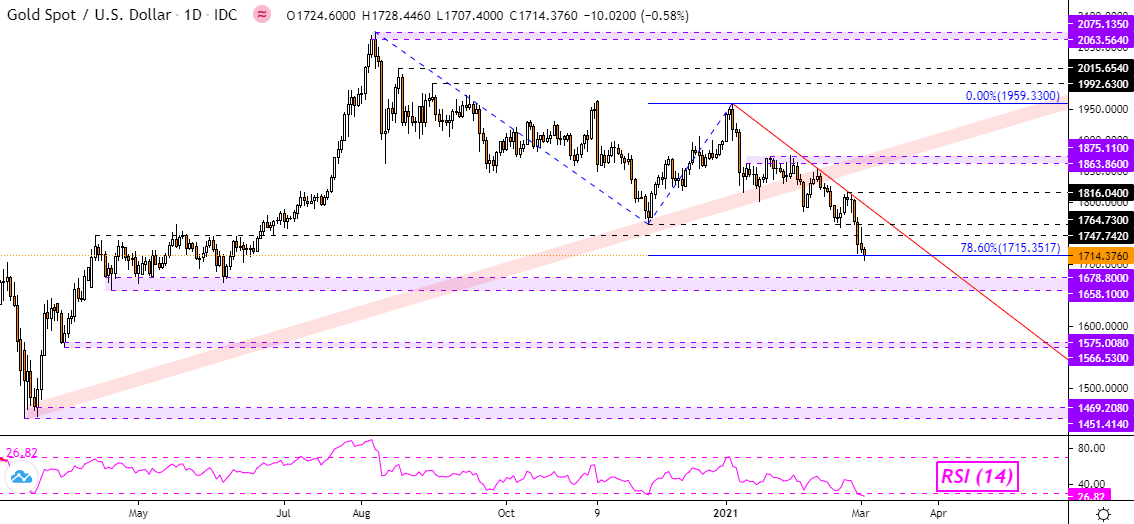
Chart Created Using TradingView
Crude Oil Technical Anaylsis
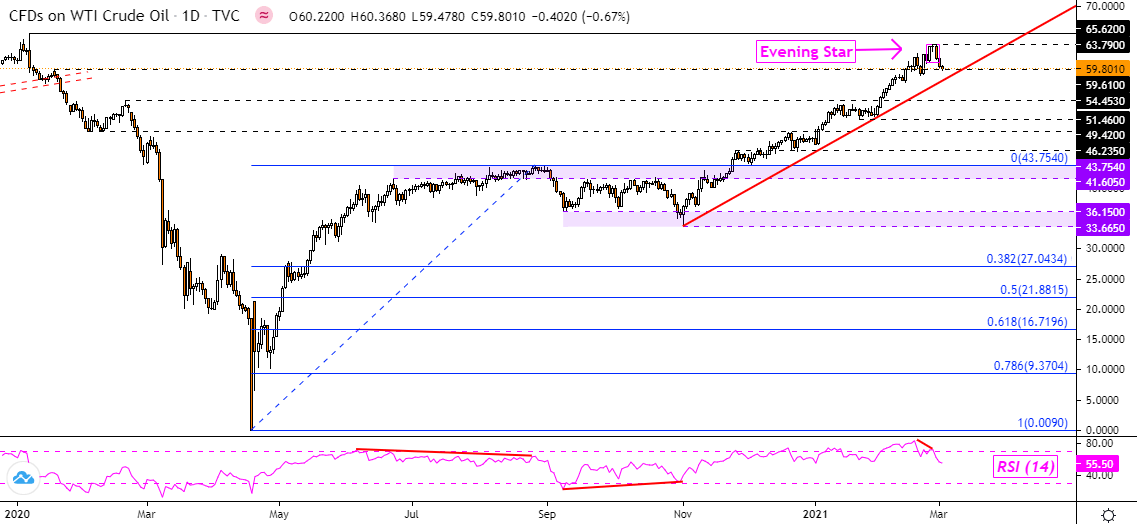
Crude oil prices are at risk after prices confirmed a daily close under the formation of a bearish ‘Evening Star’ candlestick pattern. However, rising support from November is maintaining the focus to the upside. So while there may be room for near-term losses, the broader bullish picture still remains intact. Resuming gains entails a push above February’s high towards last year’s peak.
WTI Crude Oil Daily Chart
(Click on image to enlarge)
Disclosure: See the full disclosure for DailyFX here.


