
1Q Forecasts: Vaccines Mean Hope Springs Eternal - Long MXN/JPY, Long Copper (XCU/USD), Long RUT & NDX
My top trade opportunities coming into 2020 were long crude oil and long CAD/JPY. Now with your laugh out of the way, in my defense, no one had “coronavirus pandemic” on their bingo card going into 2020.
Going into 2021, this time will be different (always fatal words, but I insist). The coronavirus vaccines are being deployed in developed Western economies, marking the beginning of the end of the pandemic. Economic activity is coming back to life. Airports are getting busier, and ports and shipping lanes are becoming more active.
In this low interest rate world with pent up aggregate demand and significant slack in the world’s major economies, there is ample room for growth. If growth is the story of 2021, the underperformers of early 2020 should do well.
US NASDAQ (NDX) DAILY CHART (DEC 2019 TO DEC 2020)
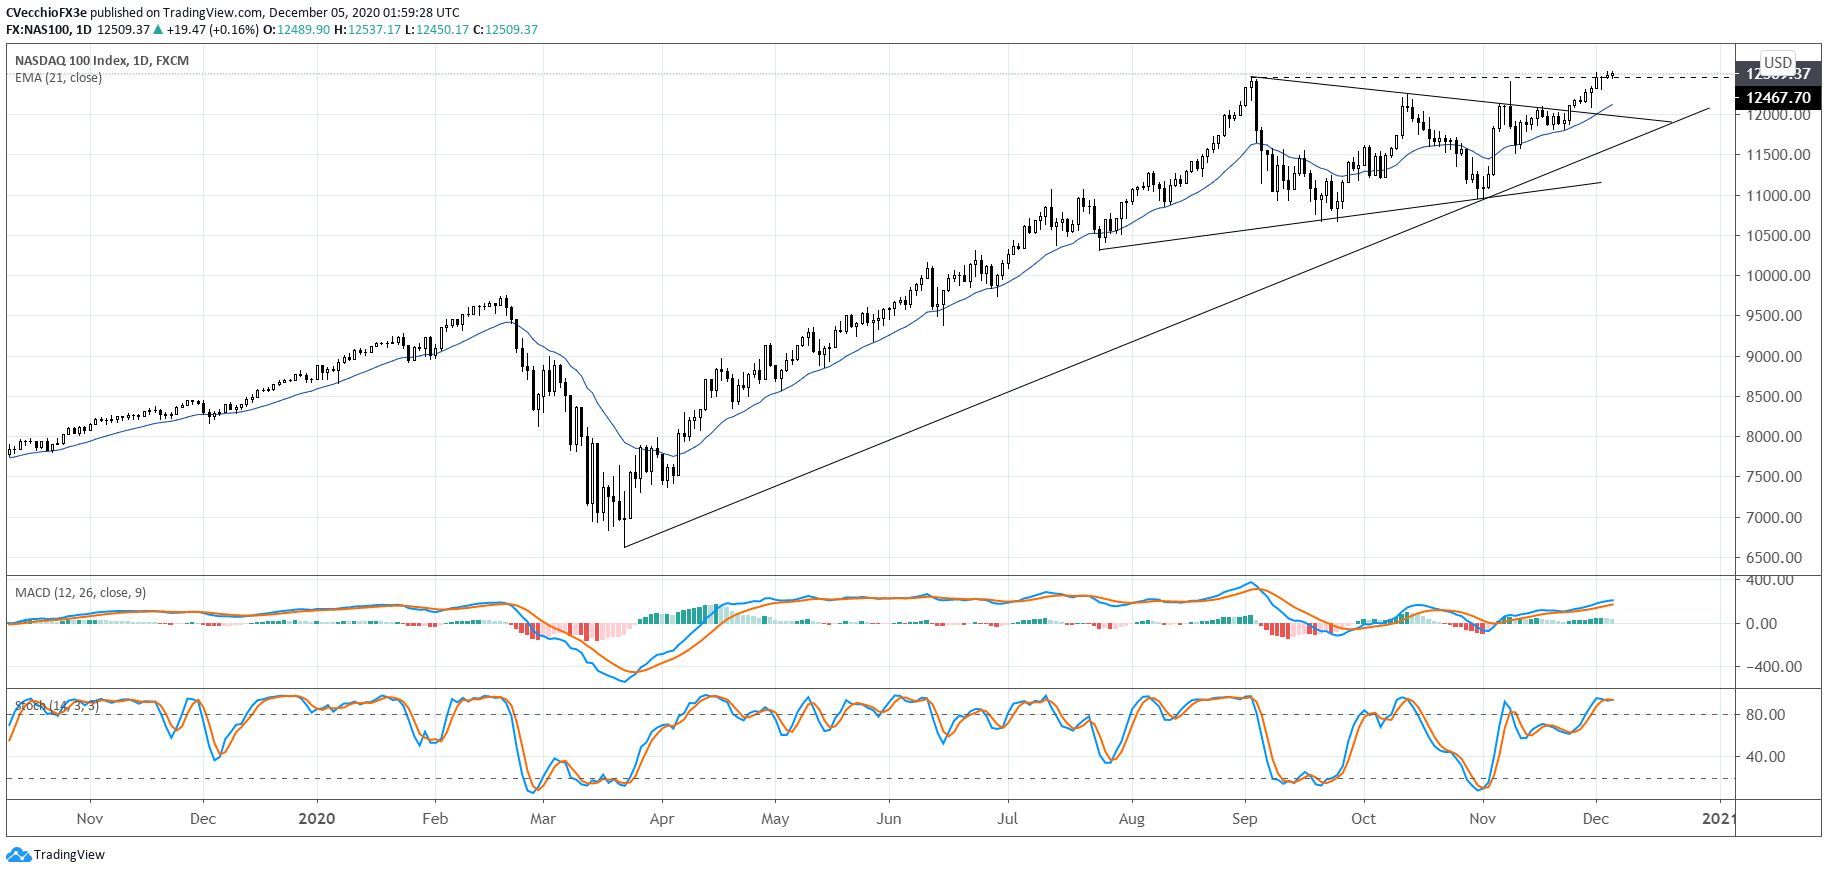
Chart prepared by Christopher Vecchio, created with TradingView
In the equity space, this reality illustrates companies with less-robust balance sheets and economic performances that may have disappointed during mid-2020. I like those that have high betas relative to the US S&P 500; small-cap and mid-cap stocks should outperform large caps ex-tech (to this end, the Russell 2000 offers more potential than the S&P 500).
But the Nasdaq 100 still looks like it wants to move higher; the symmetrical triangle breakout in early December 2020 appears to be just getting started.
COPPER (XCU/USD) WEEKLY CHART (DEC 2010 TO DEC 2020)
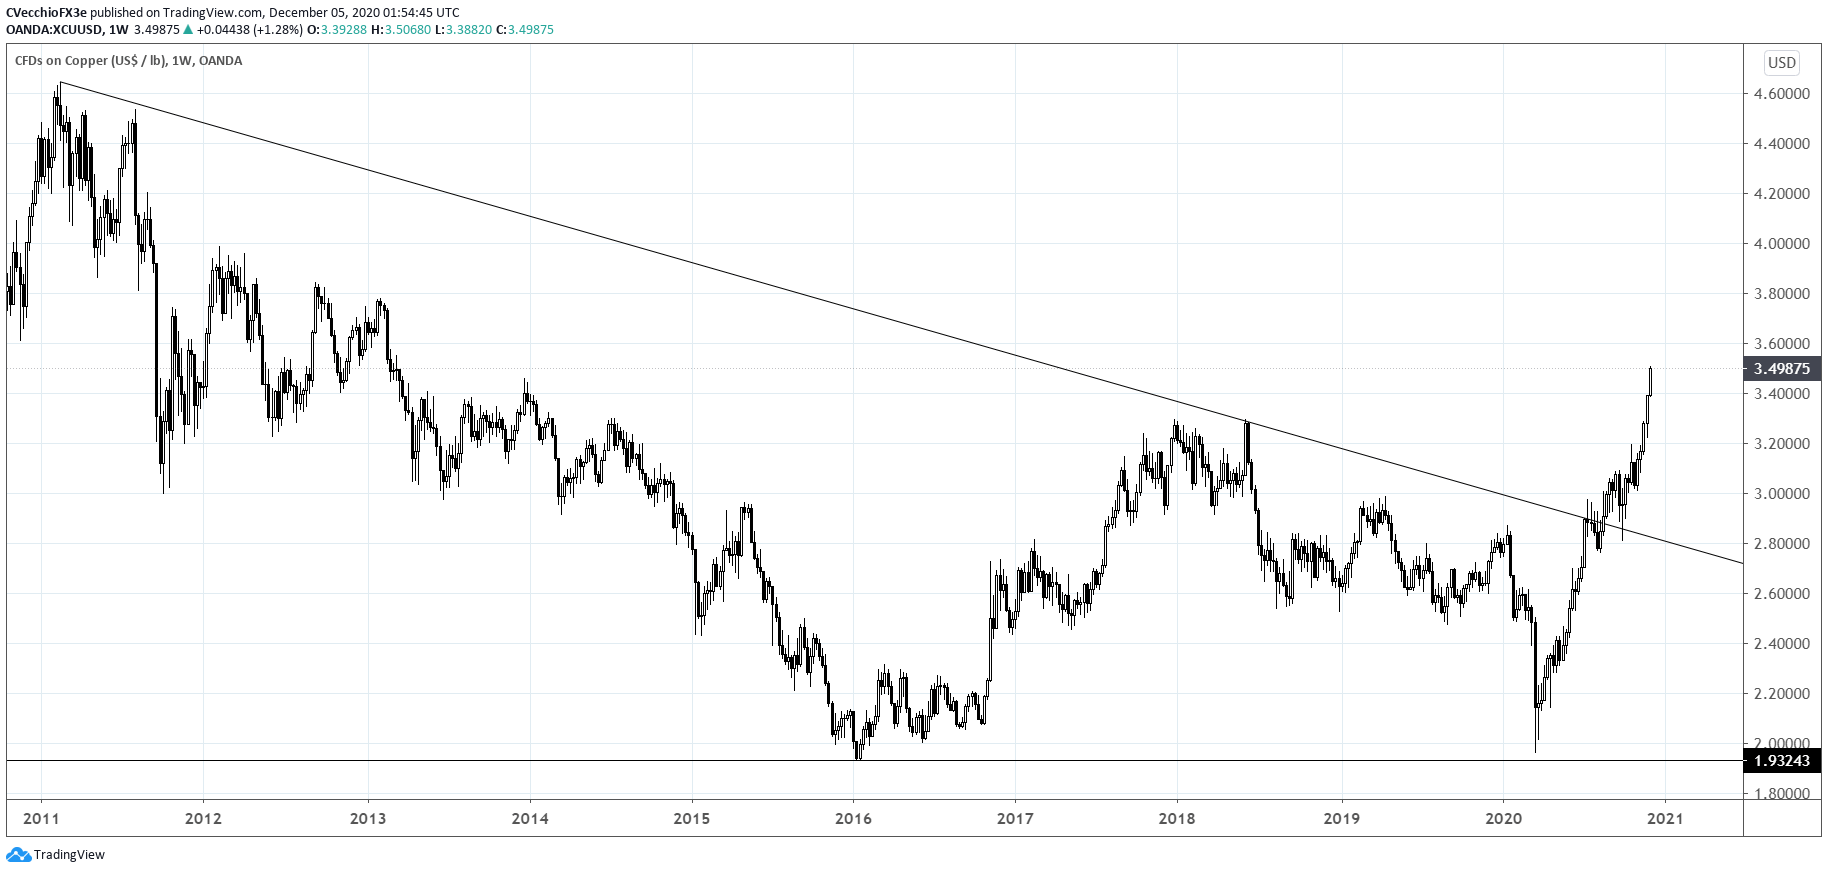
Chart prepared by Christopher Vecchio, created with TradingView
In the metals space, copper and silver appear poised to outperform gold, which typically trails during periods with high liquidity and high growth. I like mixed exposure of long copper and short gold, or long silver and short gold, which potentially curtail upside potential yet add diversification to portfolio composition.
MXN/JPY DAILY CHART (AUG 2011 TO DEC 2020)
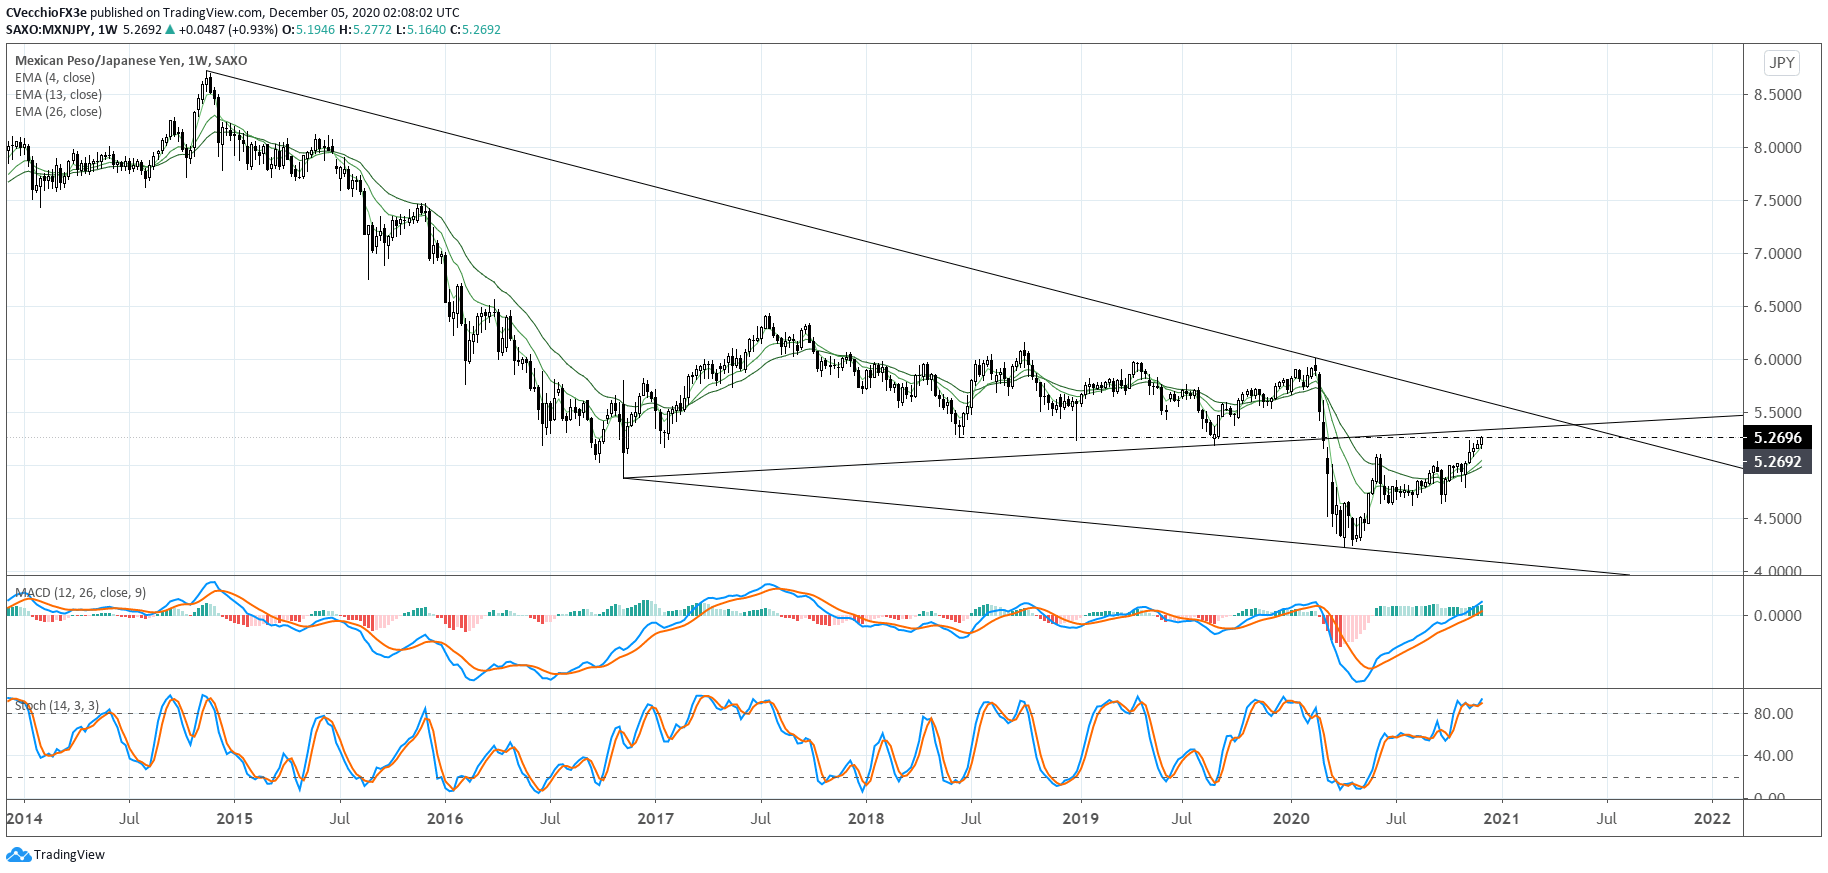
Chart prepared by Christopher Vecchio, created with TradingView
In FX markets, EM FX should continue to outpace developed FX, with pairs like MXN/JPY and ZAR/JPY outpacing pairs like GBP/CHF or USD/JPY. The Mexican Peso is of particular interest, given the country’s exposure to the silver trade as the world’s top exporter of silver, as well as its reliance on the US economy: 30% of Mexican GDP can be attributed to trade activity with the US.
Elsewhere in FX, It would not surprise me if EUR/USD rates jump to 1.3000 in the first half of 2021, especially if USD/CNH continues to fall (the PBOC is leveraging the Euro to sink the US Dollar, a strategy in line with China’s issuance of USD-denominated debt, as a weaker US Dollar makes the debt cheaper to service).
Lastly, I think that both GBP/USD and USD/JPY rates will end the year not too far from where they began, as choppy, sideways price action appears likely for the foreseeable future.


